Figures & data
Figure 1. Data sources feeding into the National Cancer Registration and Analysis Service (NCRAS).
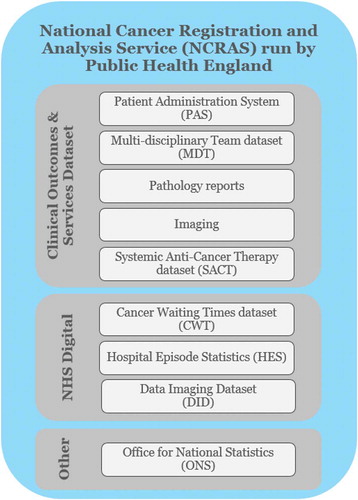
Table 1. Clinical outcomes explored in the data capture and gap analysis*.
Figure 2. Select key assumptions used in the top-level cost estimates.
* The number of NHS trusts in which ATMPs in oncology adopted through an OBR scheme. ** The number of ATMPs in oncology adopted with an OBR in each of the trusts above.
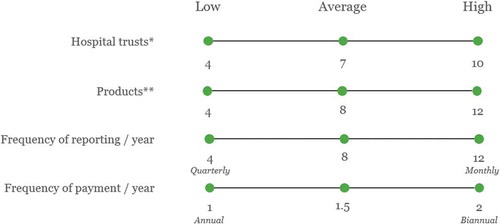
Figure 3. SACT data completeness (2017–18) for select data fields relevant to OBR [Citation22].
Abbreviations: M = ‘Mandatory’ data field (i.e., has to be completed in order for the submission to be accepted); R = ‘Required’ (must be included ‘where available or applicable’); TNM = Primary tumor (T), Regional lymph nodes (N), Distant metastasis (M); OPCS code = Classification of Interventions and Procedures.
![Figure 3. SACT data completeness (2017–18) for select data fields relevant to OBR [Citation22].Abbreviations: M = ‘Mandatory’ data field (i.e., has to be completed in order for the submission to be accepted); R = ‘Required’ (must be included ‘where available or applicable’); TNM = Primary tumor (T), Regional lymph nodes (N), Distant metastasis (M); OPCS code = Classification of Interventions and Procedures.](/cms/asset/4e175dbb-38e0-4459-9a52-aa14e92fdc0a/zjma_a_1635842_f0003_oc.jpg)
Table 2. Gap analysis of outcomes that can be collected through the current data fields included in the SACT database and EBMT registry.
Figure 4. Top-level cost estimate for upgrading SACT and EBMT (using a manual workaround) to enable OBR in oncology in England.
(A) = Patient-level assessment at national level; (B) = Patient-level assessment at trust level; (C) = Cohort-level assessment at national level; (D) = Cohort-level assessment at trust level
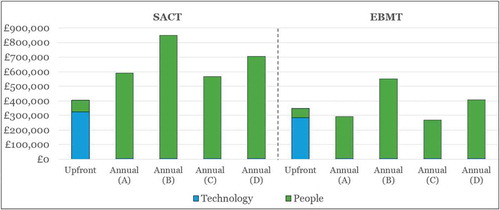
Figure 5. Top-level cost estimate for upgrading SACT and EBMT (using part automation) to enable OBR in oncology in England.
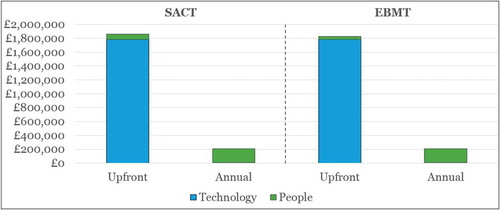
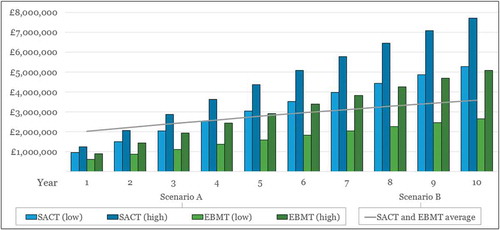
Figure 6. Cumulative costs* of upgrade Scenarios A (manual workaround) and B (part automation) for SACT and EBMT over time.
* Future costs discounted at an annual rate of 3.5%Low = Outcomes assessed at the cohort/national level; High = Outcomes assessed at the patient/trust level.