Figures & data
Figure 1. Identification of SMA cases and controls included in the claims database analysis
Table 1. Demographic and insurance plan characteristics for cases and controls
Table 2. Most common diagnoses during an inpatient service for SMA cases versus controls for infantile, child, and juvenile SMA
Table 3. Mean (SD) inpatient costs for SMA cases versus controls for infantile, child, and juvenile SMA (2019 USD)
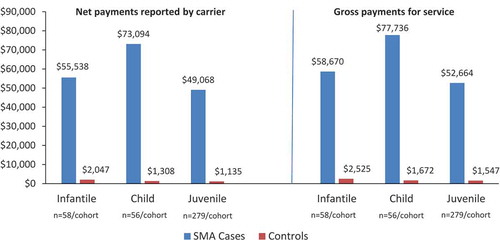
Figure 2. Mean total net payments for inpatient admissions for SMA cases versus controls for infantile, child, and juvenile SMA (2019 USD).*
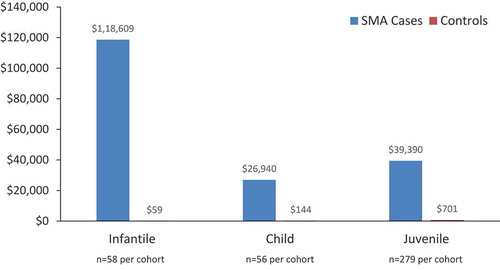
Table 4. Five most common outpatient services for SMA cases versus controls for infantile, child, and juvenile SMA
Figure 3. Mean outpatient costs for all years for SMA cases versus controls for infantile, child, and juvenile SMA (2019 USD)