
Figures & data
Table 1. Characteristics of studies registered in the ClinicalTrials.gov database between 2007 and 2020.
Figure 1. Dynamics of the number of ongoing trials between 2007 and 2020. The red line represents the ETS model fitted to data from the ClinicalTrials.gov database for the number of ongoing clinical trials during the pre-COVID-19 period (2007–2019), and the forecasted numbers for the four quarters of 2020 predicted by the ETS model.
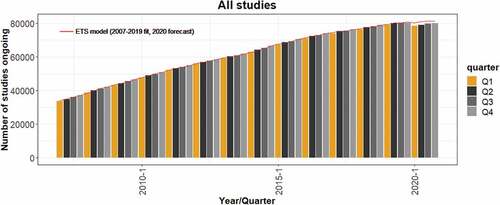
Figure 2. Differences between the actual and predicted number of clinical trials in 2020 Q1–Q4. Values represent the difference between the actual numbers of registered clinical trials in 2020 and the forecasted values based on the ETS model fitted to data from 2007 to 2019. Colored bars, all studies; empty bars, non-COVID-19 studies only. The proportions (%) in the bottom panel were calculated relative to the number of predicted studies for each quarter.
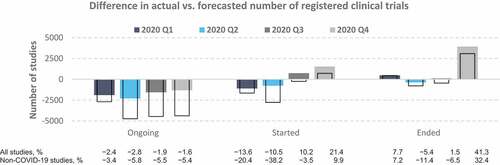
Figure 3. Differences between the actual and predicted number of clinical trials on infectious diseases. Values represent the difference between the actual numbers of registered clinical trials in 2020 and the forecasted values based on the ETS model fitted to data from 2007 to 2019. Colored bars, all studies; empty bars, non-COVID-19 studies only. The proportions (%) in the bottom panel were calculated relative to the number of predicted studies for each quarter.
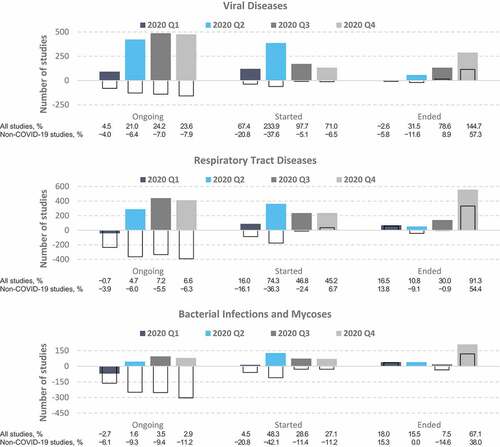
Figure 4. Differences between the actual and predicted number of clinical trials on noncommunicable diseases. Values represent the difference between the actual numbers of registered clinical trials in 2020 and the forecasted values based on the ETS model fitted to data from 2007 to 2019. Colored bars, all studies; empty bars, non-COVID-19 studies only. The proportions (%) in the bottom panel were calculated relative to the number of predicted studies for each quarter.
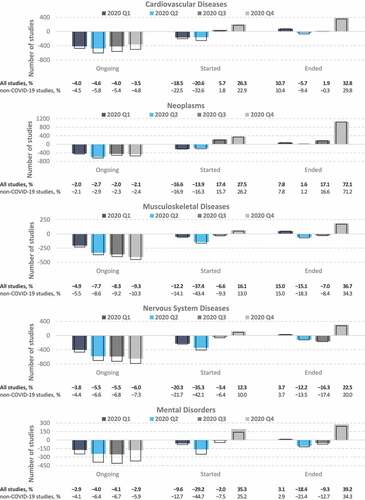
Table A1. Number of ‘missing’ ongoing non-COVID-19 trials based on the ETS model forecast for 2020.
Table A2. Number of actual ongoing, started, and ended trials per health domain vs. the forecasted values.
Table A3. Number of ongoing COVID-19 trials during each of the four quarters of 2020.