Figures & data
Figure 1. Model Schematic. Module (1) projected the size of the target population and divided them by their treatment status. Module (2) calculated the average direct medical cost and productivity loss per patient. Multiplying the number of patients projected by module (1) and per patient average cost and loss by module (2) gave the total cost and benefits for a specific scenario.
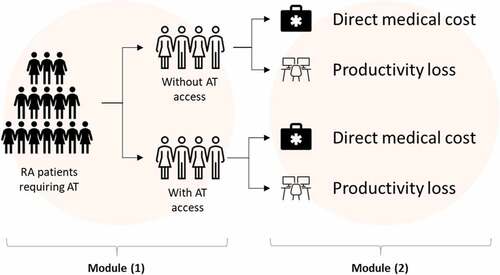
Figure 2. Six sub-modules within the direct medical cost calculation.
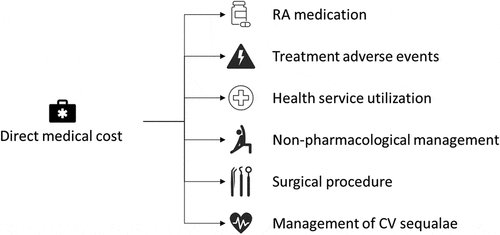
Table 1. Input values used in the model for the population size projection.
Table 2. Projected patient number and the breakdown by at access status under the status quo scenario.
Table 3. Projected patient number with at access under three access improvement scenarios. Yoy = year-on-year.
Table 4. Projected total and subcategory direct medical costs under the status quo scenario.
Table 5. Projected 5-year total differential direct medical cost in between the status quo scenario vs. the three access improvement scenarios.
Table 6. Projected 5-year differential productivity cost in between the status quo scenario vs. the three access improvement scenarios.
Table 7. Projected 5-year differential drug cost under different at utilization mixes scenarios (20% improvement scenario used).
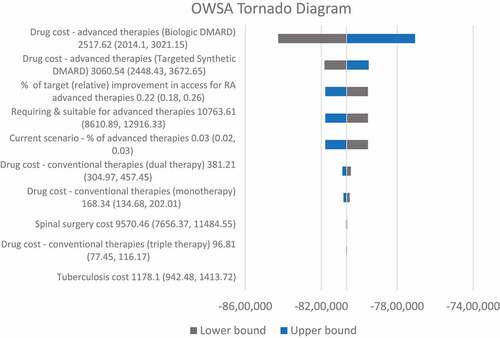
Figure 3. Results of the one-way sensitivity analysis using a 20% range in both directions.