
Figures & data
Figure 1. Budget impact model structure.
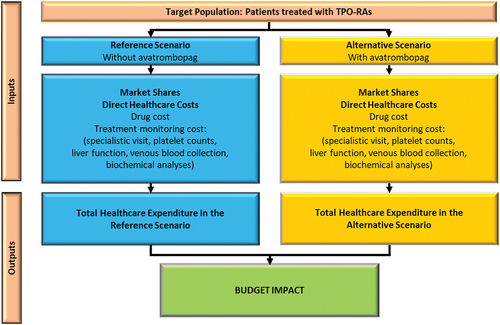
Table 1. Target population*†.
Table 2. Estimated patients and market shares broken down by year and therapy: base case and sensitivity analysis *†.
Table 3. Monitoring costs per patient.
Table 4. Cost per patient/year: base case and sensitivity analysis.
Figure 2. Budget Impact and healthcare expenditure variation per year, linked with avatrombopag reimbursement (Alternative – Reference scenario) per year: base case analysis.
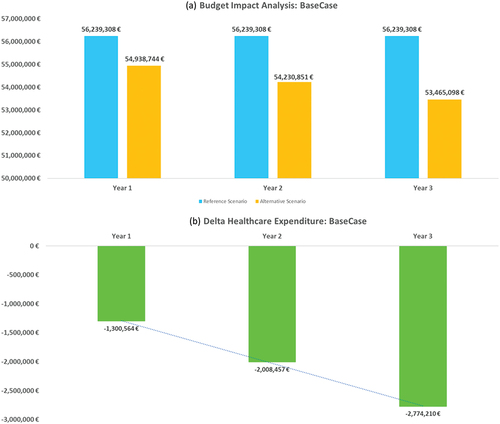
Table 5. Budget impact analysis: base case analysis.*
Figure 3. Budget Impact and healthcare expenditure variation per year, linked with avatrombopag reimbursement (Alternative – Reference scenario) per year: sensitivity analysis.
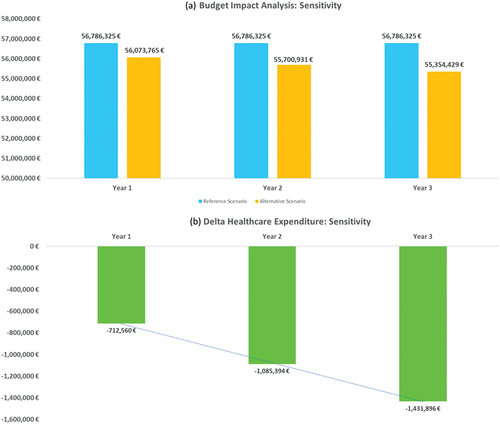
Table 6. Budget impact analysis: sensitivity analysis.*