Figures & data
Table 1. Outpatient prescription and defined daily dose (DDD) of 2015–2019 (N = 12).
Figure 1. Pharmacoeconomic indicators of medicine (N=12).
The date of 12 months was computed, and the sample size of N was 12.
* P<0.05, **P<0.01In 2016, public hospitals in 200 Chinese pilot cities abolished 15% of markups on pharmaceuticals. The proportion
of medicine income to total hospital income of 2015-2019 was shown in , it ranged from 26.66% to 25.31%. The
proportions of antibiotic revenue to medicine revenue from 2015 to 2019 were 37.53%, 29.80%, 26.41%, 20.87% and
19.24%, respectively. The proportion of antibiotic revenue to western medicine revenue of 2015-2019 decreased from
26.69% to 14.78%.
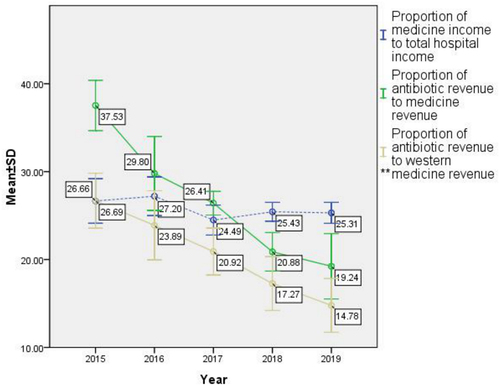
Table 2. WHO/INRUD core drug indicators of 2015–2019 (N = 12).
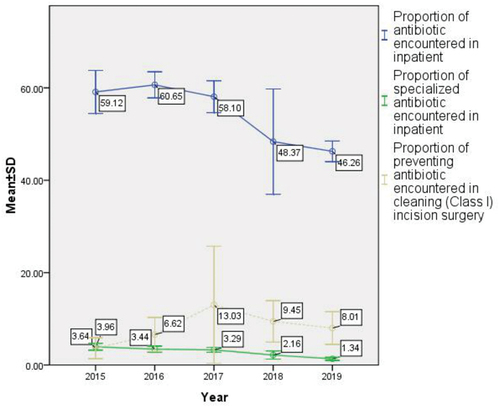
Figure 2. Indicators of specialized and preventive antibiotics (N=12).
The date of 12 months was computed, and the sample size of N was 12.
The standard of specialized antibiotics was in the Inclusion and Exclusion Criteria.
* P<0.05, **P<0.01The proportion of antibiotics encountered in inpatient care shown in decreased from 59.12% to 46.26%. The proportions of specialized antibiotics encountered in inpatient care from 2015 to 2019 were 3.96%, 3.44%, 3.29%, 2.16% and 1.34%, respectively. The proportions of antibiotic prevention encountered in cleaning (Class I) incision surgery from 2015-2019 was 3.64%, 6.62%, 13.03%, 9.45% and 8.01%, respectively. The indicators achieve the antibiotics goals which established by the NHCPRC in 2015, i.e., the proportion of antibiotic prophylaxis in patients receiving type I incision operations/clean operations should be ≤30%.