
Figures & data
Figure 1. Money and utility gain flow of the consumer market.
D discount; I investment; P price.
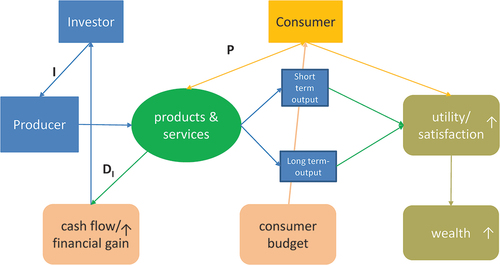
Figure 2. Money and utility gain flow of the healthcare market.
D discount; I investment; M money; H health; QALY Quality adjusted life years; P price; dotted line = indirect impact; St short term; Lt long term.
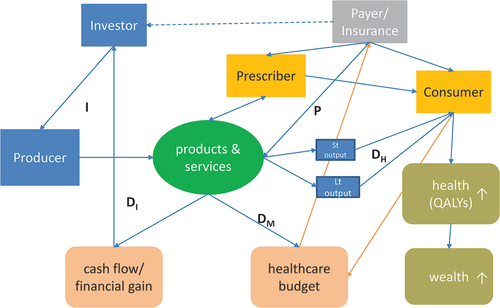
Figure 3. From product to output and value in the consumer market.
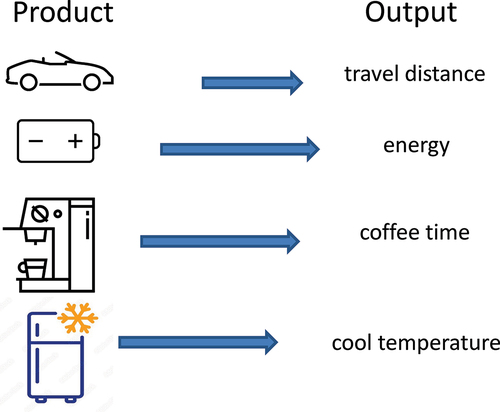
Figure 4. Comparing price-setting in the ‘open’ consumer (A) versus the ‘non-market’ healthcare world (B).
P: price; n: amount; D: equal discount; ND: no discount; Cn: cost neutral; Cm: maximum cost; ICER: incremental cost effectiveness ratio.
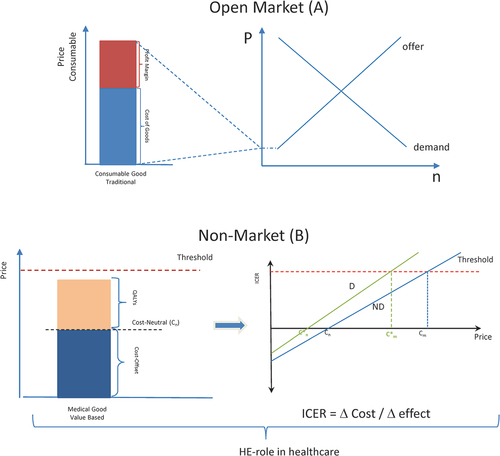
Figure 5. Difference in relative price reduction as a function of health discount and timing of the QALY gain.
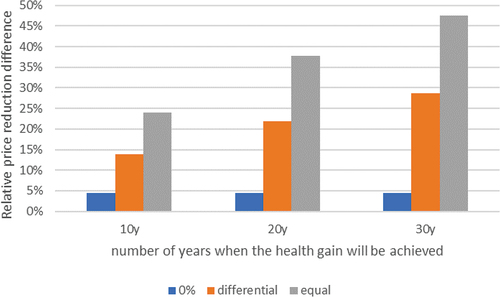
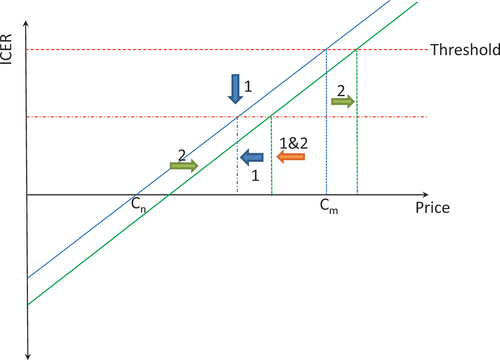
Figure 6. Changing other items (threshold (1) and cost (2)) to review price-setting in healthcare.
Cn: cost neutral; Cm: maximum cost; ICER: incremental cost effectiveness ratio.
Table
Data availability statement
Data sharing is not applicable to this article as no new data were created or analyzed in this study.