Figures & data
Figure 1. Flowchart of the trial (CONSORT flow diagram, www.consort-statement.org).
Table 1. Baseline characteristics.
Table 2. Track list for the categories in the group of self-selected music.
Figure 2. Timeline.
BP = blood pressure; HR = heart rate; RR = respiratory rate; SaO2 = oxygen saturation; STAI = Spielberger’s state trait anxiety inventory; VAS = visual analogue scale.
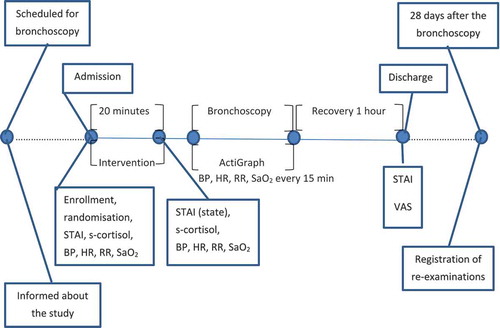
Table 3. Comparison of STAI scores.
Figure 3. Mean difference of STAI state score (Δ-STAI) from admission to 20 min with or without music prior to bronchoscopy.
There was a significant effect of music on change of STAI score from admission to 20 min with or without music [F (2, 297) = 8.68, p < 0.001, ω = .05]. Tukey-adjusted post-hoc comparisons indicated that the change in STAI state score was significant with self-selected music (mean±SD) (−6.3 ± 6.2) compared with that for the control group (no sound) (−2,9 ± 5.1) (p < 0.001; d 0.6). MusiCure™ (−4.6 ± 5.9) did not significantly differ from no music (p = 0.1) nor from self-selected music (p = 0.09) in terms of change in STAI state score.
![Figure 3. Mean difference of STAI state score (Δ-STAI) from admission to 20 min with or without music prior to bronchoscopy.There was a significant effect of music on change of STAI score from admission to 20 min with or without music [F (2, 297) = 8.68, p < 0.001, ω = .05]. Tukey-adjusted post-hoc comparisons indicated that the change in STAI state score was significant with self-selected music (mean±SD) (−6.3 ± 6.2) compared with that for the control group (no sound) (−2,9 ± 5.1) (p < 0.001; d 0.6). MusiCure™ (−4.6 ± 5.9) did not significantly differ from no music (p = 0.1) nor from self-selected music (p = 0.09) in terms of change in STAI state score.](/cms/asset/4d31645f-48ee-49e9-8582-a921c7fb3e0f/zecr_a_1583517_f0003_b.gif)
Figure 4. Patients overall perception of the sound prior to and during bronchoscopy.
There was a highly significant difference between the music groups and the control group [H (2) = 33.81, p < 0.001]. When analysing the differences between the three treatments, the median VAS score of the control group (median (IQR); 4.5 mm (8.1)) compared with that for the group receiving MusiCure™ (8.3 mm (2.4); p < 0.001) and that of the group receiving self-selected music (8.1 mm (2.9); p < 0.001) was highly significant. No significant difference was found between MusiCure™ and self-selected music (p = 1.0).
![Figure 4. Patients overall perception of the sound prior to and during bronchoscopy.There was a highly significant difference between the music groups and the control group [H (2) = 33.81, p < 0.001]. When analysing the differences between the three treatments, the median VAS score of the control group (median (IQR); 4.5 mm (8.1)) compared with that for the group receiving MusiCure™ (8.3 mm (2.4); p < 0.001) and that of the group receiving self-selected music (8.1 mm (2.9); p < 0.001) was highly significant. No significant difference was found between MusiCure™ and self-selected music (p = 1.0).](/cms/asset/491e6fba-dfd1-40d5-b100-a031abff8670/zecr_a_1583517_f0004_b.gif)
Figure 5. STAI change from admission to after 20 min with or without music divided by how the patients appreciated the sound measured by VAS.
There is only a significant difference in STAI change in the upper tertile of VAS measuring how patients appreciated the sound. (Kruskal–Wallis test is used because of the very different sizes of the groups).