
Figures & data
Figure 1. Patient flowchart
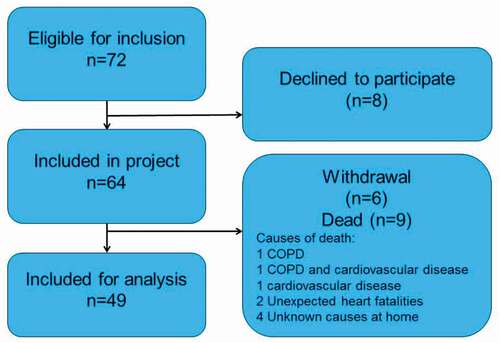
Table 1. Characteristics of patients (n = 49)
Table 2. Means before and after the intervention for the eight subscales in CAT (n = 49)
Table 3. Differences in total CAT score before and after the intervention
Figure 2. Total CAT score before and after the intervention
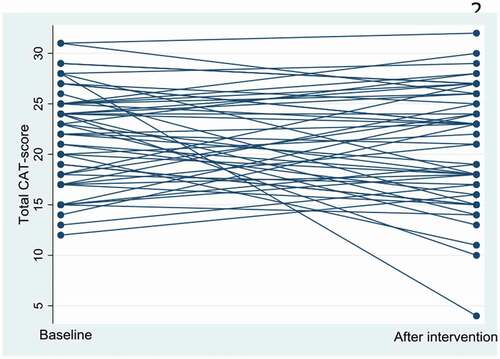
Table 4. Observed and predicted numbers of admissions and length of hospital stay per patient
Figure 3. Number of admissions and mean length of stay in days per admission
Observed admissions and length of stayPredicted admissions and length of stayObserved admissions and length of stay during intervention.
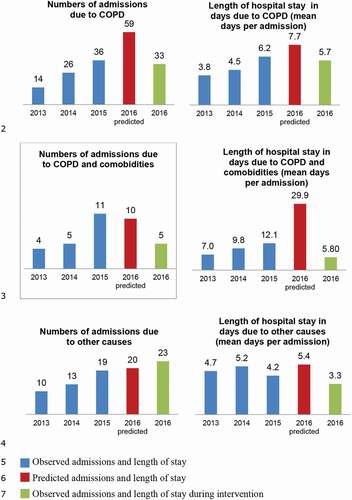
Table 5. Number of observed admissions and length of hospitalizations versus predicted for 2016