
Figures & data
Table 1. Patient characteristics; demographic data, clinical exposures and total number of events.
Figure 1. Shows patient flow from screening, to inclusion and through first 24 hours treatment and into Days Alive and Out of Hospital up until 30 days from admission (DAOH-30). The flowchart illustrates the composites of ‘Treatment failure’ and ‘late hypercapnic respiratory failure’ by showing a) the number of events within first 24 hours of treatment, B) number of events after 24 hours of treatment given by numbers (%); ‘treatment failure’ 132 (45.6%) and ‘late hypercapnic respiratory failure’ 28(9%) and C) total number of events.
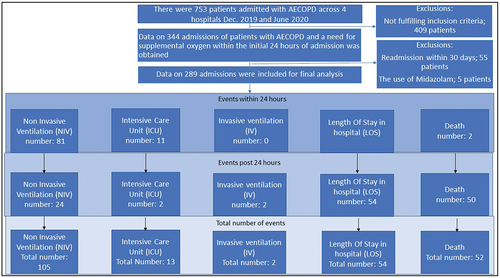
Figure 2. Forest plot showing risks of exposures as Odds Ratios [95% Confindence Intervals] in relation to low numbers of days alive and out of hospital within 14 days and treatment failure.
![Figure 2. Forest plot showing risks of exposures as Odds Ratios [95% Confindence Intervals] in relation to low numbers of days alive and out of hospital within 14 days and treatment failure.](/cms/asset/5894e72e-87c3-415b-b5b4-073d4c5288ab/zecr_a_2153644_f0002_b.gif)
Table 2. Associations between exposures and outcomes NB: Only powered for the oxygenation variables (marked with #).