
Figures & data
Figure 1. Timeline of events during investigation of a hospital acquired Legionnaires’ disease — in the West Bank, 2014. Abbreviations: NSAIDs: Non-steroidal anti-inflammatory drugs, ICU: Intensive Care Unit, BAL: Bronchoalveolar Lavage, Sg: Serogroup, ST: Sequence Type and AQU: Al-Quds University. Timeline represents days and the data presented are from one hospitalized patient. BAL sample was analyzed twice, at day 5 and day 10.
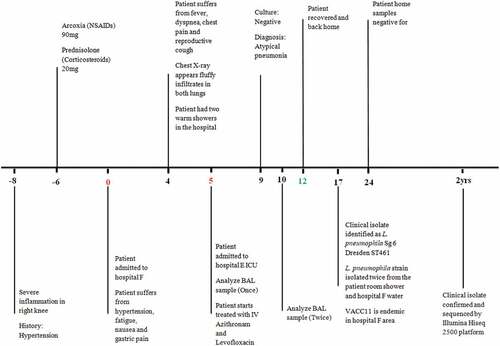
Table 1. Main features of L. pneumophila clinical isolate used in the study.
Figure 2. A) Zoomed in Phylogenomic tree of L.pneumophila clinical isolate (Alaw1_cl_ps) and 15 L. pneumophila reference genomes and subspecies delineation based on the GBDP phylogenetic analyses retrieved from the TYGS website. the dark green squares showed ALAW1 clustered together with the two reference genomes Alcoy 2300/99 and Corby. The branch lengths are scaled in terms of GBDP distance formula d4 (the whole phylogenomic tree of Legionella species and subspecies in supplementary materials (Figure S2). B) Gingr visualization of 15 L. pneumophila reference genomes and L.pneumophila clinical isolate aligned with Parsnp. The leaves of the reconstructed phylogenetic tree (left) are paired with their corresponding rows in the multi-alignment. L. pneumophila str. Alcoy 2300/99 is the reference genome. The constructed tree share 72% of the core genome. The gray region isn’t a part of core genome. The white region is a part of core genome but no SNPs accumulation. The heatmap on the button of the figure indicates more reddish meaning more SNPs accumulation..
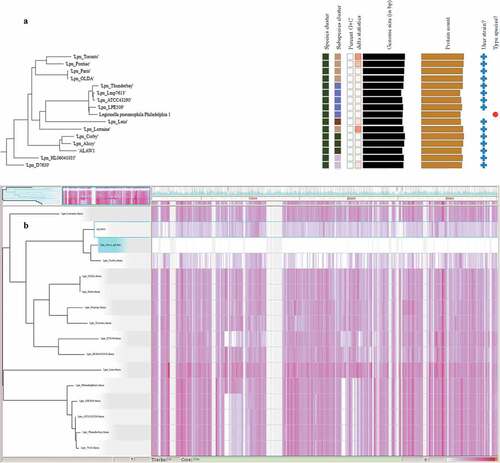
Table 2. Whole-genome SNP comparison of L. pneumophila isolates and reference strains.
Table 3. Percentage of nucleotide identity of orthologous pore-forming activity genes with respect to the BLASTp search against the VFDB using L. pneumophila strain Philadelphia1 as default reference genome.
Supplemental Material
Download MS Word (735.3 KB)Data availability statement
Data are available at GenBank accession numbers JALDWK000000000. Furthermore, short read sequencing data is provided in NCBI Sequence Read Archive under BioProject ID PRJNA817377.Full WGS methods and results are provided in the Supplementary Data.