
Figures & data
Figure 1. Flowchart of patient recruitment.
Flowchart of included participants. Lost to follow-up is reported for primary outcome (ACQ-5).
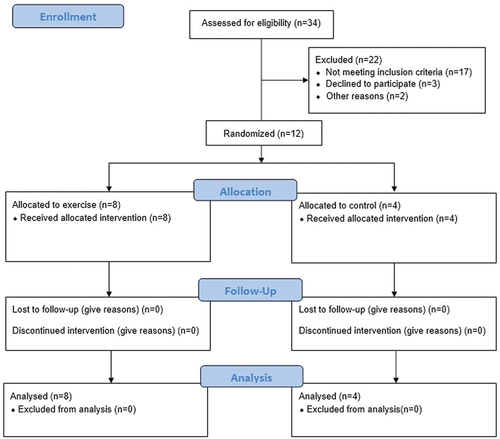
Table 1. Participant characteristics.
Table 2. Baseline echocardiography measurements.
Figure 2. Change in primary outcome measure, ACQ-5.
Change in ACQ-5 among participants in the control group (left) and the exercise group (right). ACQ-5, Asthma Control Questionnaire-5.
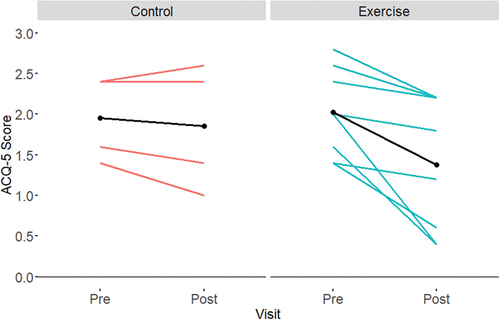
Figure 4. Change in airway inflammation measured by FeNO.
Change in airway inflammation measured by FeNO among participants in the control group (left) and the exercise group (right). FeNO, Fraction of exhaled nitric oxide; ppb, parts per billion.
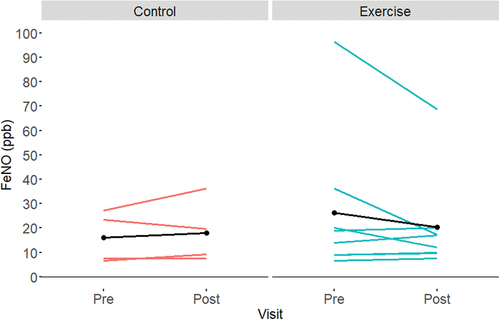
Table 3. The effect of exercise on secondary outcomes.
Figure 3. Change in FEV1.
Change in lung function (FEV1) among participants in the control group (left) and the exercise group (right). FEV1, Forced expiratory volume in 1 second; L, liters.
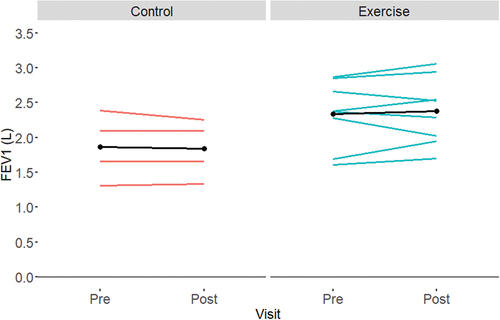
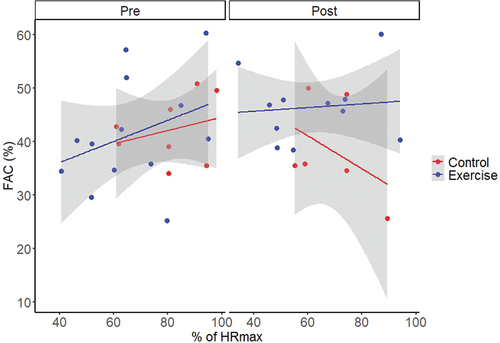
Figure 5. Change in right ventricular heart function measured by fractional area change during increasing workloads.
Change in fractional area change (FAC) presented with 95% confidence limits during increasing workloads. Each participant is measured three times at different workloads with pulse determining each participant’s workload at as a percentage of HRmax achieved at maximal oxygen at consumption test. There were no significant differences between the groups. HRmax, maximal heart rate
Data availability statement
Data will be made available upon reasonable request as determined by the study authors.