
Figures & data
Figure 1. TUS findings and corresponding score. a) The pleural line (PL) appears normal. No B-lines or consolidations are present corresponding to a score of 1. b) Multiple B-lines (B) originating from the pleural line. The B-lines involve less than 50% of the pleural line, corresponding to a score of 2. c) Multiple confluent B-lines (CB) are present. More than 50% of the pleural line is involved corresponding to a score of 3. d) A small subpleural consolidation (C) is present just below the pleural line, corresponding to a score of 4. Image courtesy of Falster et al. [Citation11].
![Figure 1. TUS findings and corresponding score. a) The pleural line (PL) appears normal. No B-lines or consolidations are present corresponding to a score of 1. b) Multiple B-lines (B) originating from the pleural line. The B-lines involve less than 50% of the pleural line, corresponding to a score of 2. c) Multiple confluent B-lines (CB) are present. More than 50% of the pleural line is involved corresponding to a score of 3. d) A small subpleural consolidation (C) is present just below the pleural line, corresponding to a score of 4. Image courtesy of Falster et al. [Citation11].](/cms/asset/b9cb8093-0068-4362-bcab-a11e4603da1a/zecr_a_2257992_f0001_b.gif)
Table 1. Baseline characteristics of patients stratified by follow-up attendance.
Table 2. Baseline characteristics of included patients stratified by ARDS during admission.
Table 3. Outcomes of included patients stratified by ARDS during admission.
Figure 2. Comparison of pulmonary function test results between patients with and without abnormal thoracic ultrasound findings.FEV1: Forced expiratory volume in 1 second. FVC: Forced vital capacity. DLCOc: diffusion capacity of the lung for carbon monoxide adjusted for hemoglobin. 6MWT: 6-minute walking distance.
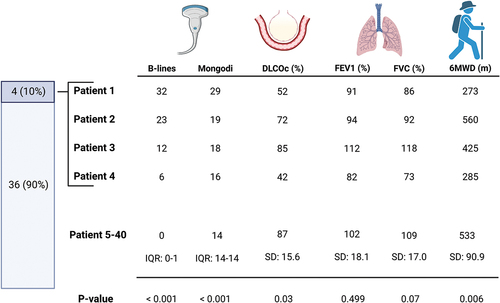
Table 4. Correlations between thoracic ultrasound findings and pulmonary function tests.