Figures & data
Figure 1. Plots showing the median target/β-actin-ratio visualised on a logarithmic conversion on the Y-axis in each group on the X-axis. Mann-Whitney U test performed for each target under the null hypothesis that the observations in each group come from the same population. CPA3: carboxypeptidase A3. EA: eosinophilic asthma. GATA2: GATA binding protein 2. HDC: histidine decarboxylase. MS4A2: membranes spanning 4A2. NEA: Non-eosinophilic asthma. TPSAB1/TPSB2: tryptase α/β-1/Tryptase β2.
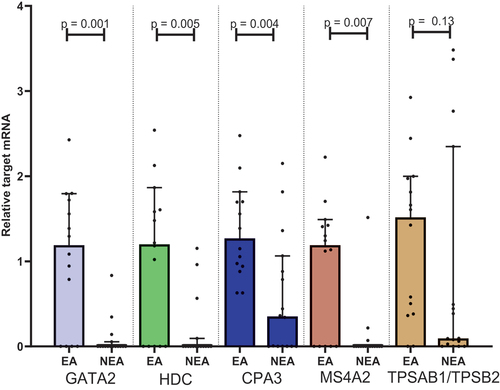
Table 1. Demographics from the EA and NEA patients. Values shown as mean ± Standard deviation. Sex and smoking are shown as proportions. BMI: Body mass index. EA: Eosinophilic asthma. NEA: Non-eosinophilic asthma. FEV1: Forced expiratory volume in 1 sec. FVC: Functional vital capacity. ICS: inhaled corticosteroid. Ppb: parts per billion. FENO: Fraction of Exhaled Nitric Oxide. *P<0.05. §ICS dose in beclomethasone (standard particle) equivalent. ΔData only available for 10 EA patients and 13 NEA patients. ◊Data only available for 11 EA patients and 11 NEA patients.
Figure 2. Spearman correlation heat map with correlation coefficients. FENO: fraction of Exhaled Nitric Oxide.
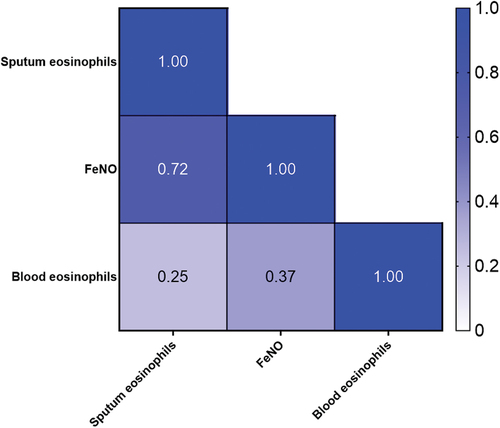
Figure 3. Scatterplot. X-axis: FeNO values in parts per billion(ppb), segmented axis. Y-axis: relative target mRNA on a logarithmic conversion. Spearman’s rank correlation coefficient (r) with 95% confidence intervals and p values. Only data from 22 patients. *p < 0.05. CPA3: carboxypeptidase A3. GATA2: GATA binding protein 2. HDC: histidine decarboxylase. MS4A2: membrane spanning 4A2. TPSAB1/TPSB2: tryptase α/β-1/Tryptase β2. FENO: fraction of Exhaled Nitric Oxide. mRNA: messenger ribonucleic acid.
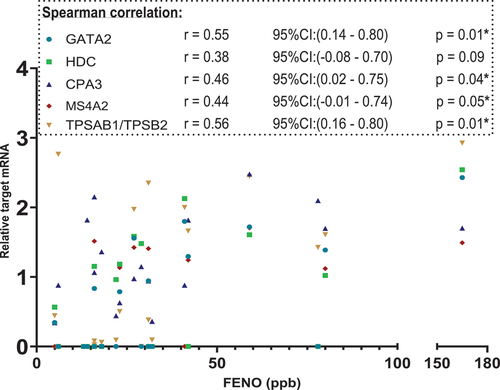
Figure 4. Scatterplot. X-axis: blood eosinophil values in 109/L, segmented axis. Y-axis: relative target mRNA on a logarithmic conversion. Spearman’s rank correlation coefficient (r) with 95% confidence intervals and p values. Only data from 23 patients. *p < 0.05. CPA3: carboxypeptidase A3. GATA2: GATA binding protein 2. HDC: histidine decarboxylase. MS4A2: membrane spanning 4A2. TPSAB1/TPSB2: tryptase α/β-1/Tryptase β2. mRNA: messenger ribonucleic acid.
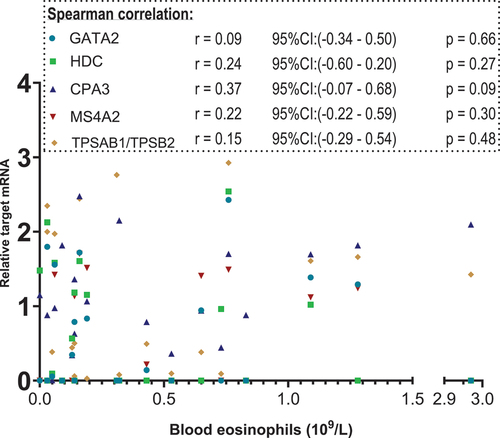
Figure 5. ROC curves for each target along with AUC displaying diagnostic ability. Y-axis: sensitivity X-axis: 1 – specificity. CPA3: carboxypeptidase A3. GATA2: GATA binding protein 2. HDC: histidine decarboxylase. MS4A2: membranes spanning 4A2. TPSAB1/TPSB2: tryptase α/β-1/Tryptase β2. mRNA: messenger ribonucleic acid.
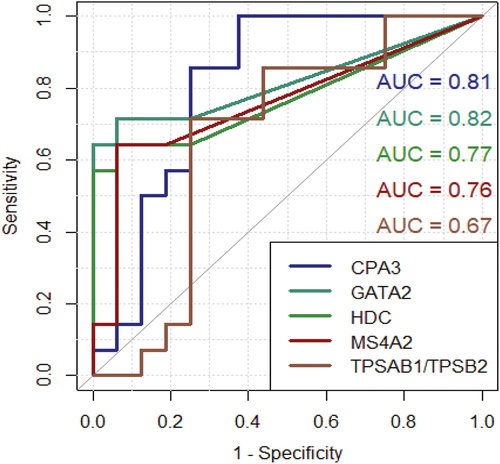
Table 2. Best cut-off value represented for each target. CPA3: Carboxypeptidase A3. GATA2: GATA binding protein 2. HDC: Histidine decarboxylase. MS4A2: Membranes spanning 4A2. TPSAB1/TPSB2: Tryptase α/β-1/Tryptase β2. mRNA: messenger ribonucleic acid.
Figure 6. Green curve: ROC curve using CPA3, GATA2, MS4A2 and HDC. Red curve: ROC curve using CPA3, GATA2, MS4A2, HDC and TPSAB1/TPSB2. Y-axis: sensitivity. X-axis: 1 – specificity.
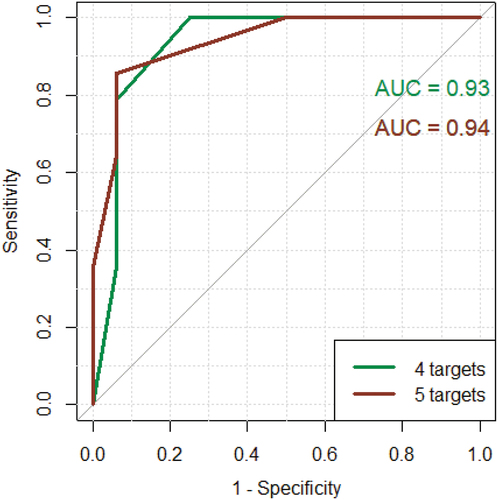
Table 3. qPCR’s ability to classify patients with EA and NEA by using ≥2 out of 5 targets Sensitivity, specificity, PPV and NPV were calculated. EA: Eosinophilic asthma. NEA: Non-eosinophilic asthma. NPV: Negative predictive value. qPCR: Quantitative polymerase chain reaction.
Figure 7. Scatter plot. X-axis: sputum eosinophils in percentage. Y-axis: targets above cut-off. Targets included: GATA2, HDC, MS4A2 and CPA3.
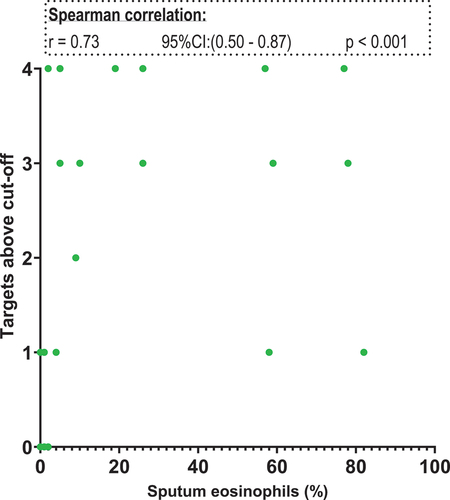
Figure 8. Scatter plot. X-axis: fraction of Exhaled Nitric Oxide in parts per billion, segmented axis. Y-axis: targets above cut-off. Targets included: GATA2, CPA3, MS4A2 and TPSAB1/TPSB2.
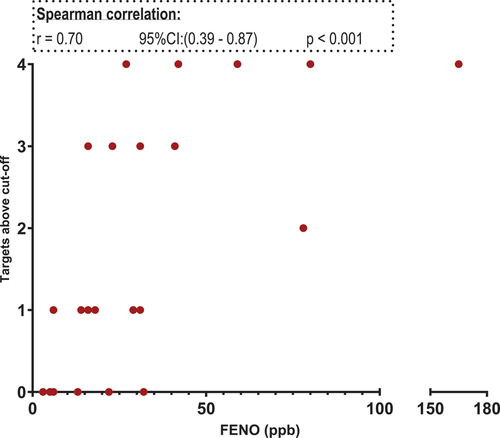
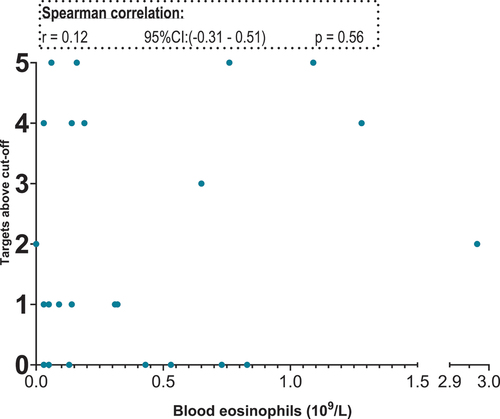
Figure 9. : scatter plot. X-axis: blood eosinophils in 109/L, segmented axis. Y-axis: targets above cut-off. Targets included: GATA2, CPA3, HDC MS4A2 and TPSAB1/TPSB2.