
Figures & data
Figure 1. Diaphragm movement during respiration measured by the area method: (a) Full inspiration, maximal area over the diaphragm; (b) Full expiration, minimal area over the diaphragm.
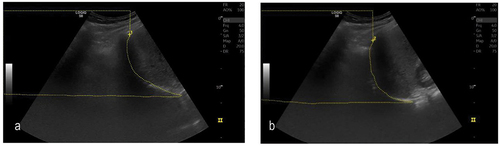
Figure 2. Flowchart showing the inclusion of patients.
Figure 3. Box plot showing patient perceived dyspnoea before and after thoracentesis measured by modified Borg scale (MBS). Wilcoxen signed rank test for p-values.
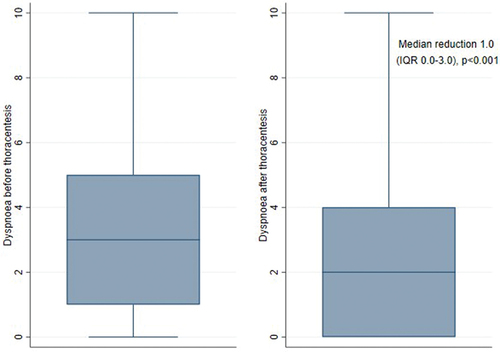
Table 1. Baseline characteristics of included patients.
Table 2. Correlation between different characteristics and having a clinical important improvement in dyspnoea measured by modified Borg scale (MBS), defined as a drop ≥ 1.
Table 3. Diaphragm shape before and after thoracentesis. N = 104.
Table 4. Diaphragm movement pre and post thoracentesis assessed by M-mode and area method. N = 104.
Table A. Modified Borg Scale (MBS).
Specification of comorbidities associated with dyspnoea, n = 50
Specification of aetiology of the pleural effusion, n = 104
Selected variables by completion of drainage (fully drained vs. not fully drained)
Selected variables by completion of drainage (fully drained vs. not fully drained)
Selected variables by signs of trapped lung (n = 104)