
Figures & data
Table 1. Demographic data.
Table 2. Respiratory characteristics in the CF and healthy control groups.
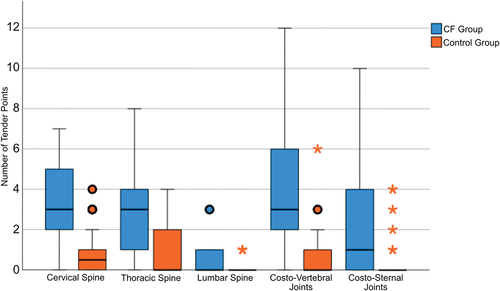
Figure 1. Number of TPs presented in median, interquartile range (IQR) and outliers by the Cystic fibrosis group compared to the healthy controls per anatomical area: 1) cervical Spine: CF group (3.0; 2.0–5.0) compared to healthy controls (0.5;0.0–1.3) (p <0.001). 2) thoracic Spine: CF group (3.0; 1.0–4.5) compared to healthy controls (0.0;0.0–2.0) (p <0.001). 3) Lumbar Spine: CF group (0.0;0.0–1.0) compared to healthy controls (0.0;0.0–0.0) (p = 0.016). 4) costo-vertebral Joints: CF (3.0;1.5–7.0) compared to healthy controls (0.0;0.0–1.0) (p <0.001). 5) costo-sternal Joints: CF group (1.0;0.0–4.5) compared to healthy controls (0.0;0.0–0.0) (p <0.001). Circles and asterisks represent data points outside the IQR, considered as mild or notably distant outliers respectively.
Data availability statement
Data will be available upon request.