Figures & data
Figure 1. Distribution of the prevalence of selected working conditions over occupational categories (Belgium, 2010). Own calculations; Data: EUROFOUND, European Working Conditions Survey, 2010 (https://www.eurofound.europa.eu/surveys/european-working-conditions-surveys), Belgium.
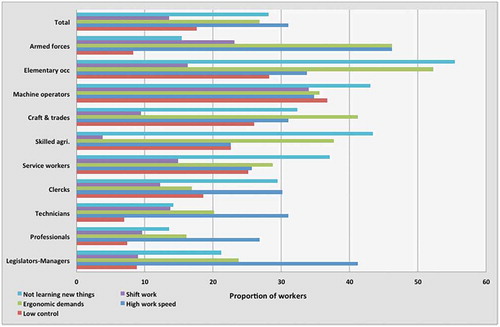
Figure 2. The prevalence of job strain in a selection of European countries (EWCS, 1995–2010).Own calculations; Data: EUROFOUND, European Working Conditions Surveys, 1995, 2000, 2005, and 2010 (https://www.eurofound.europa.eu/surveys/european-working-conditions-surveys).
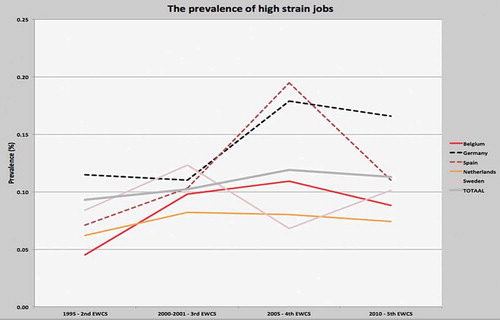
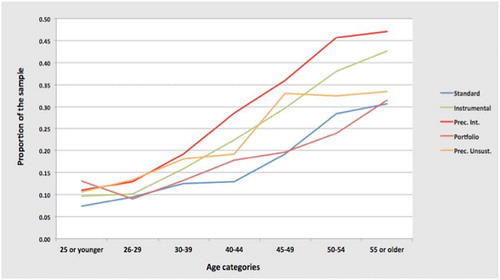
Figure 3. The age-stratified distribution of the association between the prevalence of general self-perceived health and employment types. Source: Malmusi (Citation2015).