Figures & data
Table 1. Functionalized CNTs modulate morphology of primary cultured mouse cortical astrocytes.
Figure 1. Scheme of experimental process of gliotransmitter on CNTs.
Cultured astrocytes on the functionalized CNTs (PEG, caroboxyl group) were assessed for distribution of GABA, glutamate uptake assay using isotope and change of conductance of CNTs by ATP.
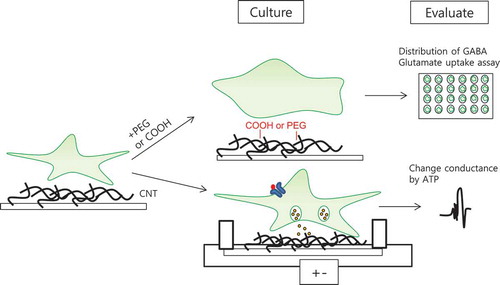
Figure 2. Glial GABA distribution on PDL and MW-CNTs (50 nm, 1,000 nm).
(a–c) Immunostaining of GABA using anti-GABA (red), anti-GFAP (green) antibody in primary cortical astrocytes on MW-CNT and PDL coverslips. Intracellular GABA in astrocytes on PDL is located near the nucleus, while astrocytes on MW-CNT 50 nm have a rounder shape compared with those on PDL. Astrocytes on MW-CNT 1,000 nm have more processes, which interact cell to cell. MW-CNT 50 nm and 1,000 nm affect distritubtuion of glial GABA. (d) Bar graph shows increased GFAP immunoreactivity of astrocytes on MW-CNTs (50 nm (n = 6), 1,000 nm (n = 6)) compared with PDL coverslips (n = 6), which have been cultured for 4 days. Scale bar: 20 μm.
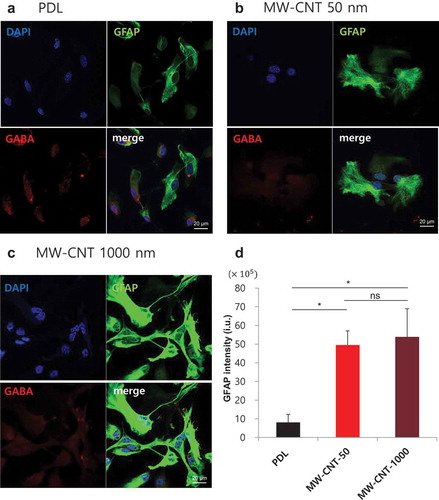
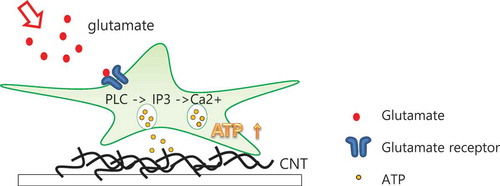
Figure 3. Illustration of active interaction region of CNTs through released ATP binding to CNT.
Released ATP from astrocytes diffused on the SW-CNT network, which means released ATP and the SW-CNT network interact by interaction.