Figures & data
Table 1: Socio-demographic and socio-economic profile of the participants.
Table 2: The score distribution of self-knowledge assessment about the 4IR.
Table 3: Independent t-test with effect sizes on the differences between genders on knowledge.
Table 4: One-way ANOVA and Post-hocs with effect size on the differences between socio-demographic and socio-economic factors.
Figure 1: Self-rating on knowledge of elements of 4IR.
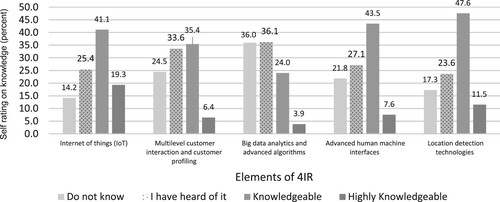
Table 5: Mann Whitney U and Kruskal Wallis H tests with effect sizes on the differences between gender on knowledge on elements of the 4IR.
Table 6: Kruskal Wallis H tests with effect sizes on the differences between genders on knowledge on elements of the 4IR.
Table 7: Kruskal Wallis H test on the differences between factors of elements of the 4IR.
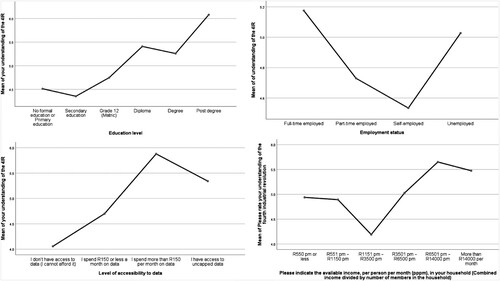
Figure 2: Means plots of the socio-economic factor group on understanding of the 4IR.