Figures & data
Figure 1. Sludge management with the most common treatment process ‘E’ is the energy required for the process (generated from fossil fuels).
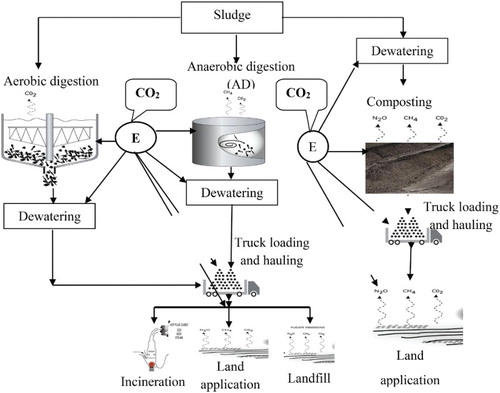
Table 1. Percentage of wastewater sludge by various disposal methods.
Table 2. Nitrogen and phosphorus contents of sewage sludge.
Table 3. Description of methods used to estimate GHG emissions due to sludge land application.
Table 4. Parameters considered for evaluation of GHGs during the land application of sludge digestate.
Figure 2. Net GHG emissions due to the land application of sewage sludge with different nutrients concentrations.