Figures & data
Figure 1. Annual surface temperature anomalies from 1898 to 2015 in Japan. Source: MOEJ (Citation2018).
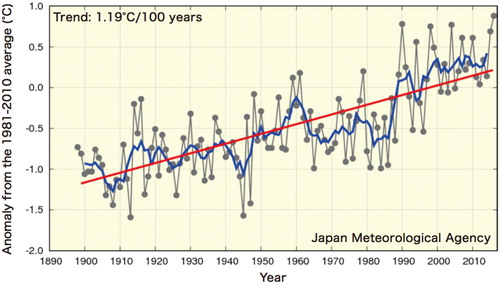
Figure 2. Annual number of days with maximum temperatures of 35°C or above (mean of 13 sites). Source: MOEJ (Citation2018).
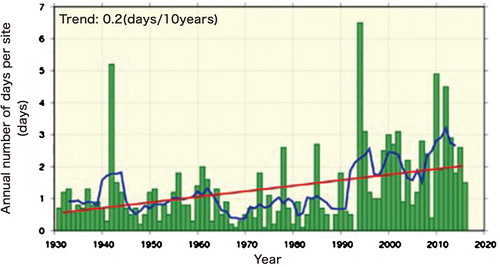
Figure 3. Number of deaths from heat illness by year and gender (1990–2016). Source: MOEJ (Citation2018).
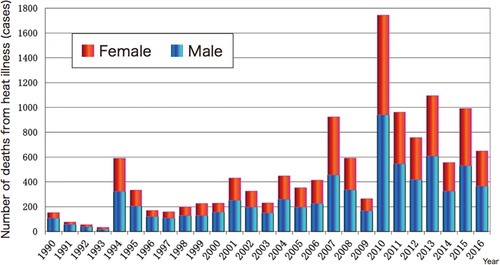
Figure 4. Osaka area flood risks in a 3°C warming scenario. Source: Holder, Kommenda, and Watts (Citation2017).
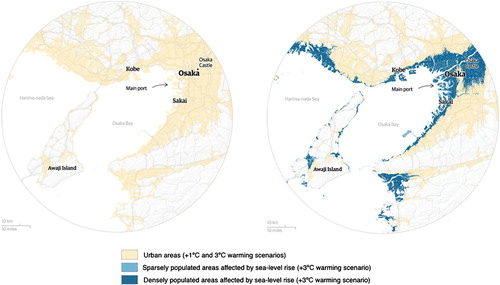
Figure 5. PRI signatories globally and in Japan. Source: PRI (Citation2020).
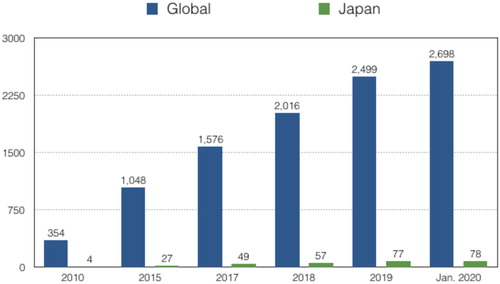
Figure 6. Core elements of recommended climate-related financial disclosures. Source: Adapted from FSB-TCFD (Citation2017).
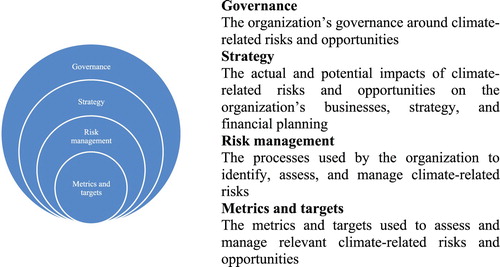
Figure 7. TCFD supporters globally and in Japan. Source: FSB-TCFD (Citation2020).
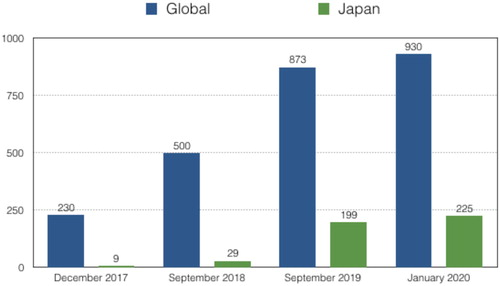
Figure 8. Number of Companies Disclosing on Climate Change under CDP, 2019. Graph displays globally (blue and green bars) and for Japan (red and orange bars): total number of companies reporting (‘total’); companies with A scores (‘A score’); A scores in the ‘General’ sector (‘A score -Sector general’); and F scores (‘F score’); vertical axis scale is logarithmic. Source: CDP Citation2020.
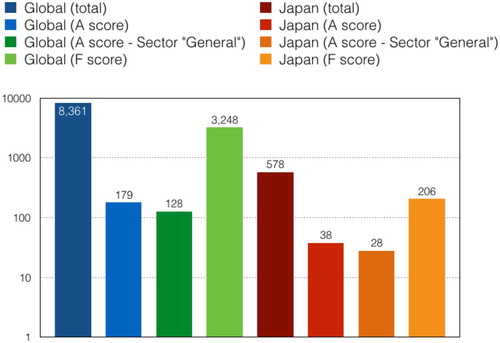
Figure 9. CDP Climate Change Disclosure Scores for Japanese Carbon-intensive Sector Companies, 2019. Source: CDP Citation2020.
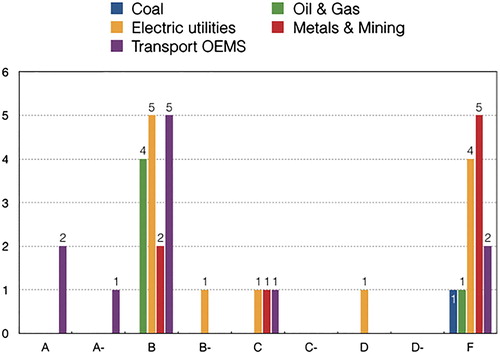
Figure 10. Annual issuance of green bonds by Japanese entities (as of August 2019). Source: The Green Bond Issuance Promotion Platform (MOEJ Citation2019).
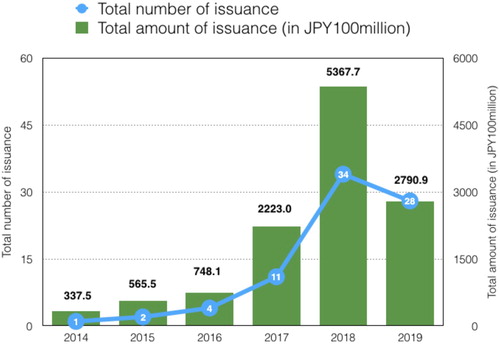
Figure 11. Japanese sustainable investment trends, 2014–2018. Sources: JSIF Citation2016, Citation2018, Citation2019; GSIA Citation2019.
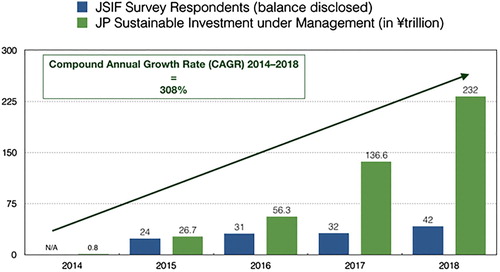
Figure 12. Global sustainable investment trends, 2014–2018. Sources: GSIA Citation2017, Citation2019.
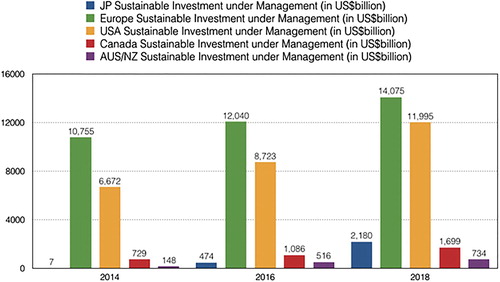
Figure 13: SBTi-committed companies from Japan (as of January 2020). Source: Science-based Targets Initiative Citation2020.
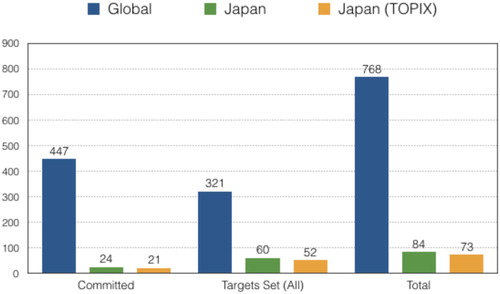
Table 1. TCFD supporters and non-supporters listed in TOPIX.
Figure 14. 2018–2023 power capacity and car production plans for TOPIX companies against IEA climate pathways (source: authors from PACTA): (a) coal power capacity; (b) gas power capacity; (c) renewable power capacity; (d) electric car production; (e) hybrid car production; (f) ICE car production.
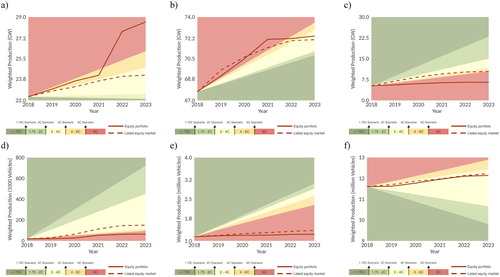
Figure 15. Regional exposure of TOPIX companies in 2023 for (a) oil production, (b) gas production, (c) gas power capacity, (d) hydropower capacity, (e) renewable power capacity.
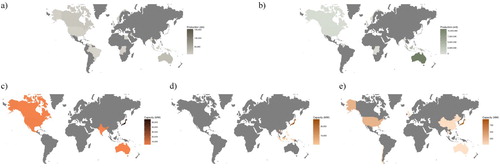
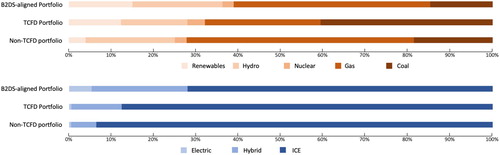
Figure 16. Comparison of 2023 technological breakdowns of power (top graph) and car (bottom graph) companies for TCFD and non-TCFD companies, with what should be a <2°C (B2DS) portfolio according to the IEA (source: authors, modified from PACTA).