Figures & data
Figure 1. Confidence bounds for different levels of tracking error.
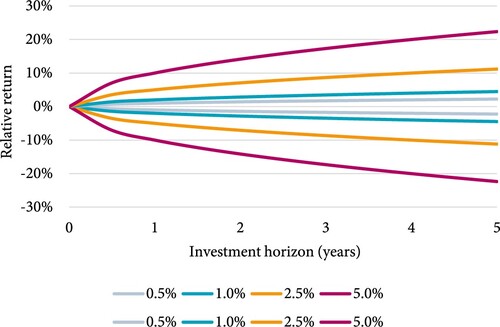
Figure 2. Conversion of tracking error into equivalent expected return loss.
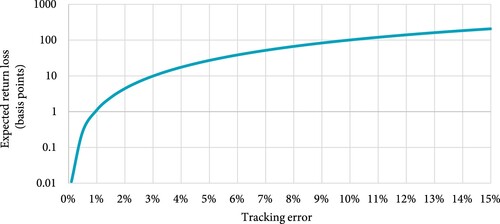
Figure 3. Tracking error of selected MSCI sustainable indices versus their parent indices, January 2015 to December 2020.
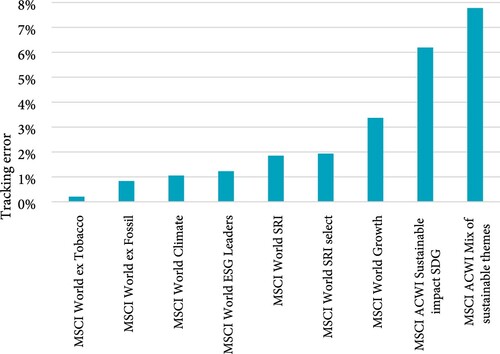
Figure 4. Aggregate exposure of 49 US industries to the size, value, profitability, investment, and low-risk factors, January 2011 to December 2020 (11 sin industries marked with a different color).
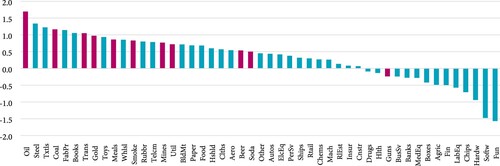
Table 1. Breakdown of factor exposures of US sin industries, January 2011 to December 2020.
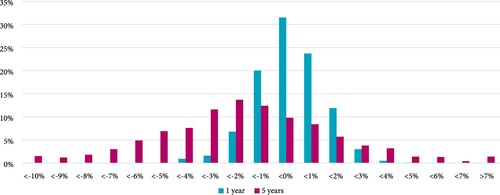
Figure 5. Distribution of boostrapped performance differences of portfolios excluding sin stocks versus the market portfolio, for 1- and 5-year investment horizon.