Figures & data
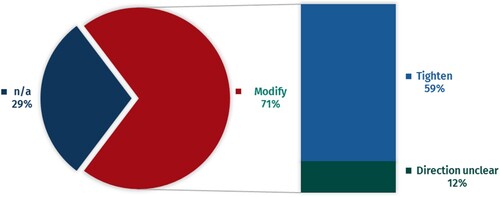
Figure 1. Respondents in the EU consultation.
Note: Total of 355 organisations and 1672 responses.
Figure 2. Two different applications of the Taxonomy. Source: own depiction.
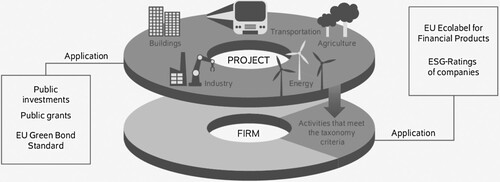
Figure 3. Three channels relating the Taxonomy to reducing greenhouse gas emissions.
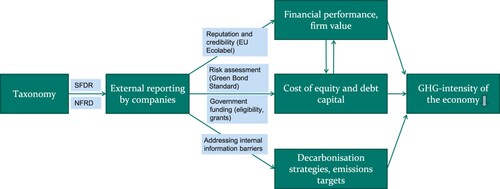
Figure 4. Greenhouse gas emissions, gross value added and employment per NACE sector (level 1 and 2). Notes: Sectors in light blue are (partly) addressed by the Taxonomy, sectors in dark blue are not covered by the Taxonomy. Sectoral emissions are presented at NACE 2 level where available, and at level 1 where no lower level exists (e.g. sectors D and G) or overall emissions of the sector are low. Source: Data for 2017 from Eurostat.
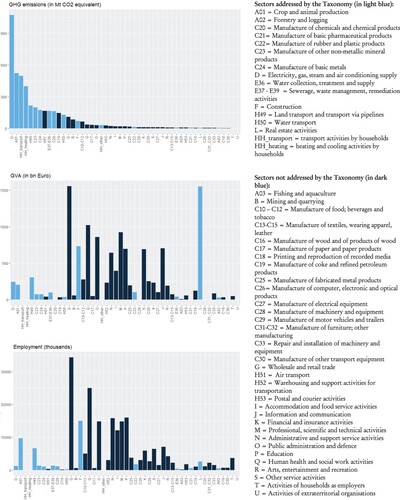
Table 1. Expanded classification of economic activities in the EU Taxonomy and their allignment with climate neutrality.
Figure 5. Perspectives on the threshold for passenger cars and commercial vehicles.
Note: n=40 respondents.
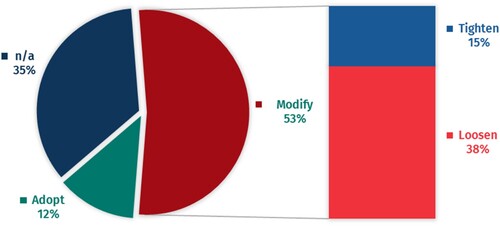
Figure 6. Perspectives of stakeholders on the building renovation threshold.
Note: n=42 respondents.
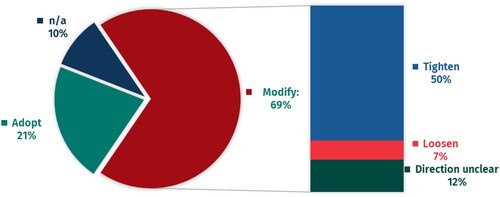
Figure 7. Perspectives of stakeholders on the threshold for the cement sector.
Note: n=17 respondents.