
Figures & data
Figure 1. UCITS ETF’s historical returns.
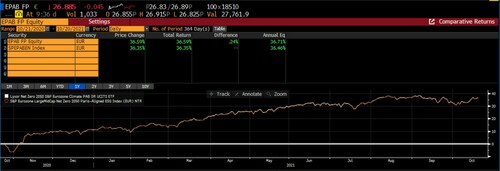
Figure 2. ZPAB:TH ETF’s historical returns.
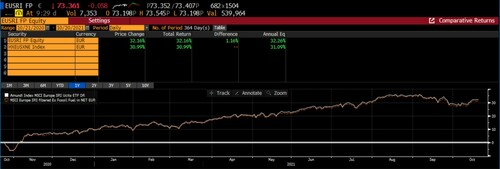
Figure 3. Green countries firm’s vs benchmark performance: utilities sector.
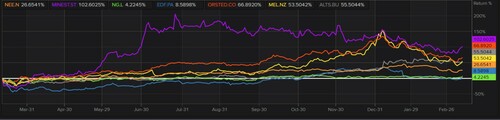
Table 1. Green countries vs Benchmark complying the HP1.
Table 2. Descriptive statistics data for variables.
Figure 4. Histogram of ESG combined scores: green countries vs Benchmark.
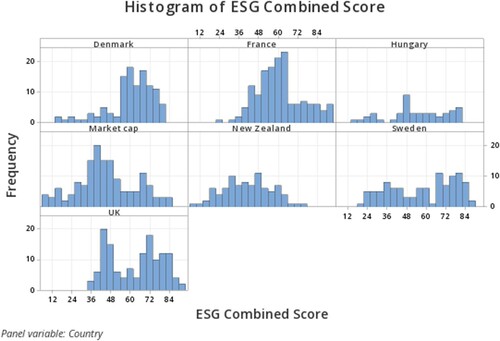
Table 3. Correlations at 95% confidence interval.
Figure 5. Interval and mean plot of ESG combined score.
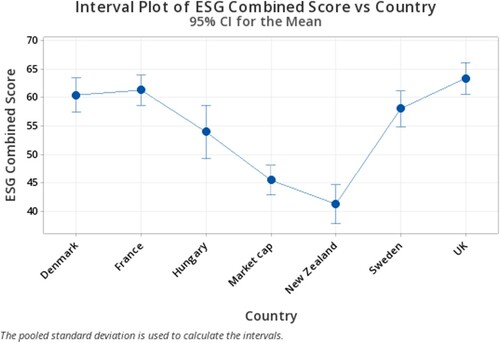
Table 4. Pooled OLS Model.
Table 5. First difference model.
Table 6. Fixed effects model.
Table 7. Random effects model.
Supplemental material