
Figures & data
Table 1. Number of announcements.
Table 2. Statistics of the nonfinancial disclosure.
Table 3. Summary statistics of the sample.
Figure 1. Overview of the study design. The figure shows the basic structure of our study design. For each firm i and nonfinancial disclosure (red in (a)) that does not overlap with other announcements (cyan in (a)) we compute the average change in analysts' forecast of earnings prior and after the event during a 30 days event window (). We then compute the same statistics over dates with no significant event (gray) and we create a null distribution (gray in (b)). Then, we compute the probability that the changes in earnings' forecasts in the null model were greater than changes occurred in the event (
). Finally, we plot the distribution of this statistics over the whole population. (c,d) show two hypothetical shapes of this distribution. We conclude that an effect exists in the population if the distribution of this statistics is not uniform, as shown in (c).
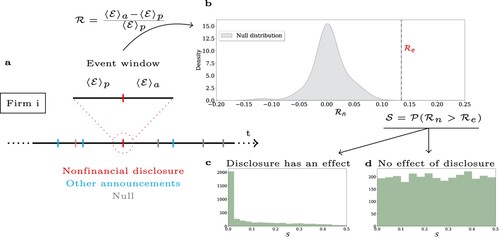
Figure 2. The impact of nonfinancial disclosure on analysts' revisions of earnings. (a) shows the distribution of the statistics as in Figure (c). The panel illustrates that there is a significant effect across the population. In (b–d), we look at the event-specific effects. Specifically, in (b), we show the distribution of the magnitude of the statistically significant and not significant effects, compared to the null model. (c) shows the evolution of the magnitude of the effects in time. Finally, (d) shows the fraction of integrated reports in the population. Overall, the figure shows that analysts revise their earnings' estimates following the disclosure of nonfinancial information. The effect of the revision is concentrated in a small fraction of the population and integrated reporting is associated with a higher likelihood of observing a statistically significant effect.
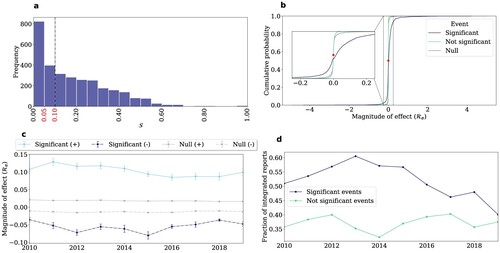
Figure 3. Analysts' reactions and information asymmetry. The figure shows the ratio (a) and the level (b) of idiosyncratic volatility in the effect and no effect population. Overall, the figure shows that the difference between the volatility in the two populations is statistically significant and persists outside the estimation window (2020).
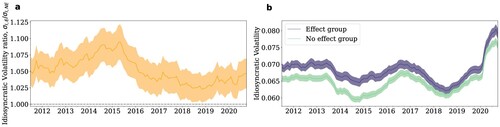
Table 4. Probit model.
Table 5. Robustness tests.
Figure 4. Effect on equity value. (a) shows the effect of disclosure of nonfinancial information on equity values at the population level. The x-axis is the number of days prior and after the event. The y-axis is the cumulative abnormal returns (in basis points). The table on the right shows the results of the test to assess the statistical significance of the effects (at multiple time windows). (b) shows the effect of disclosure after publications with positive, negative and no effect on the revision of earnings. Overall, the table and the figure in (b) show that the disclosure of non financial information has a significant impact on firms' market value of equity but the effect is not homogeneous across the population. (c,d) shows the effect after the publication of standalone and integrated reports, respectively. The panels show that the statistically significant impact of CSR reporting on equity values is strongly driven by the publication of integrated reports.
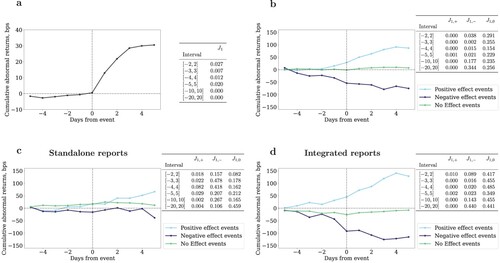
Figure 5. No effect on cost of capital in our sample. (a) shows the distribution of the statistics , which, differently from Figure (a), is approximately uniform in [0,0.5]. (b) shows the distribution of the effect of disclosure on cost of capital for the events when analysts submit a statistically significant revision (blue) and a not statistically significant revision (green). The panel shows that none of the two distributions is significantly different from the null model. Overall, the figure shows that the disclosure of nonfinancial information has no measurable effect on cost of capital in our sample.
![Figure 5. No effect on cost of capital in our sample. (a) shows the distribution of the statistics SWACC, which, differently from Figure 2(a), is approximately uniform in [0,0.5]. (b) shows the distribution of the effect of disclosure on cost of capital for the events when analysts submit a statistically significant revision (blue) and a not statistically significant revision (green). The panel shows that none of the two distributions is significantly different from the null model. Overall, the figure shows that the disclosure of nonfinancial information has no measurable effect on cost of capital in our sample.](/cms/asset/84c424a1-4c4c-4d70-881d-60271ed0a0a9/tsfi_a_2228746_f0005_oc.jpg)