
Figures & data
Figure 1. Summary of sectoral impacts on the 16 SDGs. All positive (green), negative (red), and ambiguous (yellow) impacts are aggregated per subsector, and the x-axis represents 100% of impacts on the 16 SDGs. As an example, ‘Tobacco Production’ has overarchingly negative impacts on 12 SDGs, positive impacts on 0 SDGs, and ambiguous impact on 1 SDG, according to reviewed literature. No documented impacts (grey) by tobacco production were found for 3 SDGs.
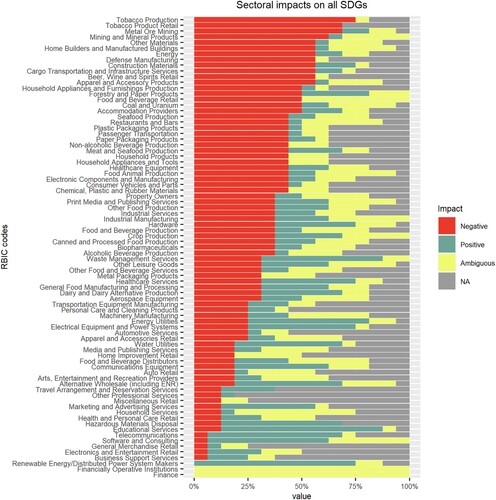
Figure 2. Aggregated impact of 81 economic sectors on each SDG. All positive (green), negative (red), and ambiguous (yellow) impacts are aggregated per SGD, and the x-axis represents 100% of the 81 economic sectors. As an example, according to the assessed literature, SDG 13 is impacted negatively by 73% sectors, positively by 7% sectors, and ambiguously by 9%. For 11% of sectors, there is no evidence to assess how they impact SDG 13.
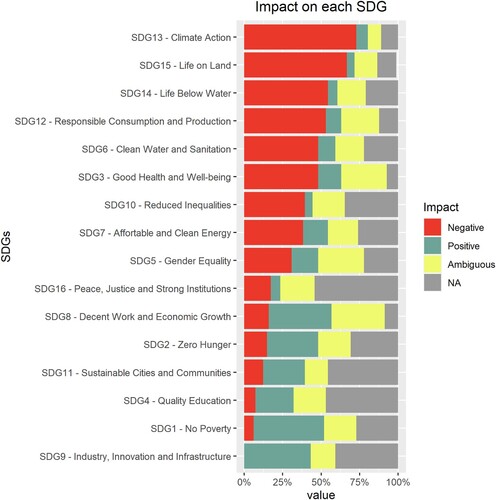
Figure 3. Impact of all assessed economic sectors on the three sustainable development pillars. Panel A: Each box represents an assessed SDG-RBICS code combination (1296 in total) and is coloured according to the assessed aggregate impact of the sector on the SDG (see ). SDGs are clustered to correspond to the three pillars of sustainability (environment, social and economic). Clusters refer to the environmental SDGs (6, 13–15, bottom layer); the social SDGs (1–5, 7, 11, 16, middle layer); the economic SDGs (8–10, 12, top layer). Panel B: The data from Panel A represented as the ‘wedding cake’ to visualize the pattern of economic sector impacts across the nested sustainability pillars. Panel C: Representation of primary, secondary, and tertiary sectors separately. Primary sector refers to natural resource extraction sectors (e.g. forestry) and includes 10 economic activities (which cover 13% of the entire FactSet L6), Secondary sector refers to sectors that process natural resources (e.g. manufacturing) (33 sectors, 37% coverage of FactSet L6), Tertiary sector refers to all sectors that are neither primary nor secondary (e.g. service sectors) (38 sectors, 44% coverage of FactSet L6).
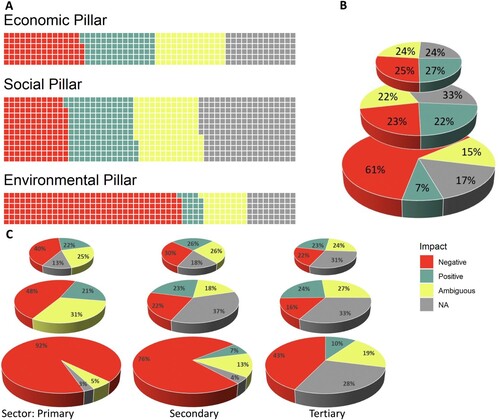
Figure 4. A generic Causal Loop Diagram on conventional crop production, illustrating direct impacts from crop production to the SDGs and indirect impacts resulting from SDG interconnections. SDGs are coloured according to which sustainable development pillar they contribute to. ‘+’ indicates a positive relationship between two variables (an increase in one, increases or enables another), and a ‘-’ indicates a negative relationship between two variables (a decrease in one, decreases or constraints another). Solid lines represent impact that emanates from crop production activities, dashed lines indicate second-order effects between SDGs or effects from crop production. The red- and blue-coloured arrows indicate two causal pathways elaborated on in the main text. For supporting evidence of each interaction and additional details, see Supplemental Material Table S5.
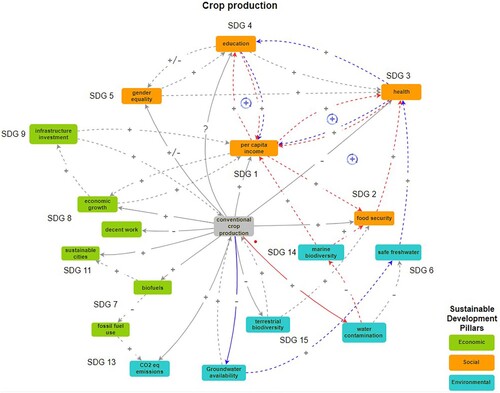
Figure 5. The hierarchical nature of SDGs necessitate a systemic conceptualization of supply chain impacts. Panel A: Impact shadow cast by a generic supply chain, where primary industries often incur a significant portion of the environmental impacts for production of raw materials used by downstream segments; Panel B: Spillovers resulting from SDG interactions illustrated in a hierarchical SDG format. Figure 5B is modified from Folke et al. Citation2016 (CC BY-NC 4.0) by inserting the arrow and '-' symbol and by reducing the figure's opacity. The original version of this figure was first presented by Rockström and Sukhdev Citation2016.
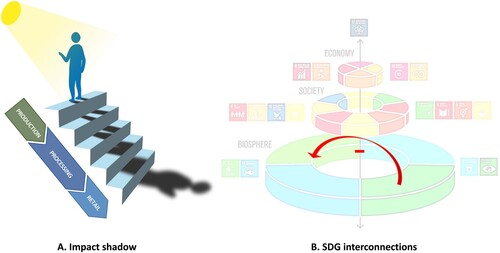
Table 1. Sustainable investing challenges: examples from investment practice.
Supplemental Material
Download PDF (1.2 MB)Data availability statement
The data that support the findings of this study is available in Figshare repository at https://doi.org/10.17045/sthlmuni.19959773.v1. The dataset is shared under the Attribution-NonCommercial-ShareAlike 4.0 International (CC BY-NC-SA 4.0) license.
