Figures & data
Figure 1. Resilience bond mechanism. Source: Re:Focus (Citation2015).
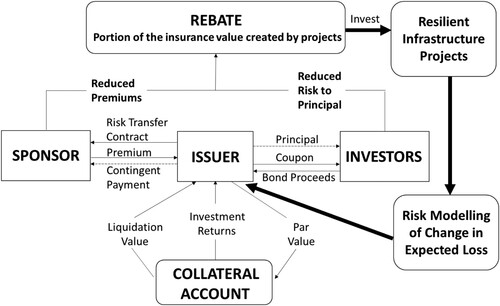
Figure 2. Flood barriers in Towyn, Wales. Source: adapted from Dawson, Peppe, and Wang (Citation2011).
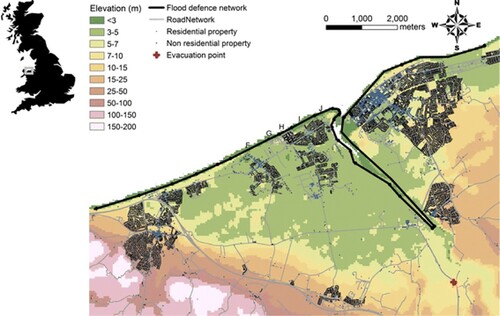
Table 1. Distribution fitness tests.
Table 2. Probability of surge levels.
Table 3. Probability of breach for each flood barrier.
Table 4. Parameters of flood resilience bond pricing model.
Figure 3. Prices of catastrophe/resilience bonds for Towyn under GEV distribution.
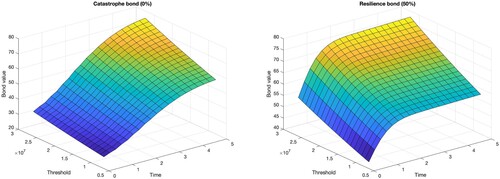
Table 5. Price of a flood catastrophe bond.
Table 6. Price of flood resilience bond with 50% resilience.
Figure 4. Price of flood resilience bond for Towyn with 10% resilience.
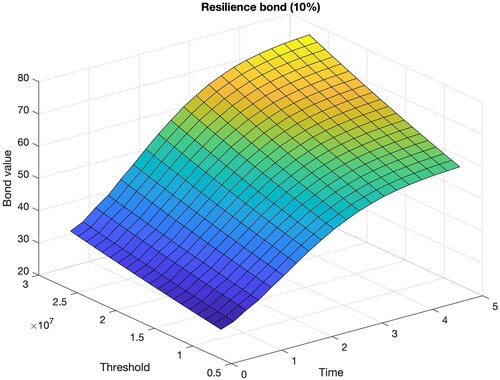
Table 7. Price of flood resilience bond (10%) under different thresholds.
Figure 5. Price of resilience bond for Towyn with 90% resilience.
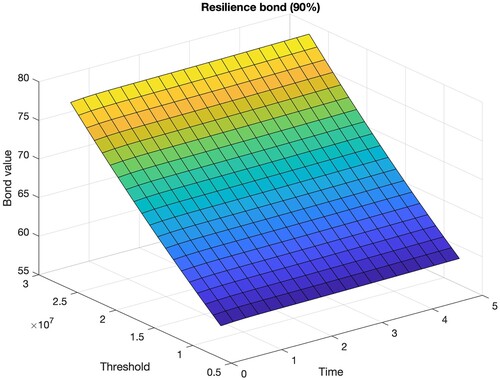
Table 8. Price of flood resilience bond (90%) under different thresholds.
Table 9. Parameters of flood resilience bond under Vasicek/CIR models.
Figure 6. Price of resilience bond with 50% resilience under Vasicek (left) and CIR model (right).
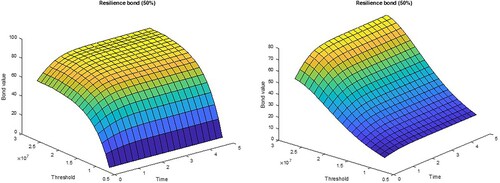
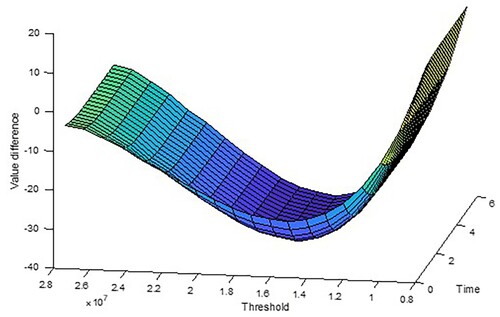
Figure 7. Value difference between applying Vasicek and CIR model.