Figures & data
Figure 1. Orthophoto of the Biharugra marsh system (top). The red dot in the inset marks the location of the study site in Hungary. Schematic map of the study site (middle) with unit types: Satellite Unit (green), Transitional Unit (blue), and Core Unit (red). The schematic vertical section of the Biharugra marsh system (bottom) with the hydrologic and hydraulic connections between the Units.
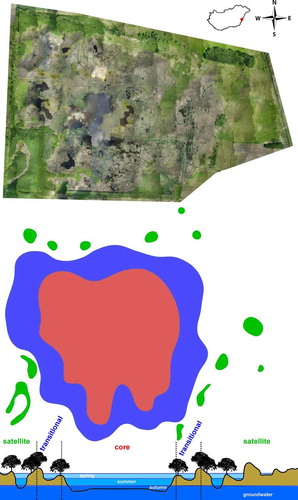
Figure 2. Venn diagram showing the numbers of unique, common, and total number of species for the 3 Units. The common subset refers to the common species among Units.
Figure 3. Species accumulation curves for each Unit (red: Core Unit; blue: Transitional Unit; green: Satellite Unit). Monotonic increases of each curve confirms that estimated species richness might be considerably higher than observed richness.
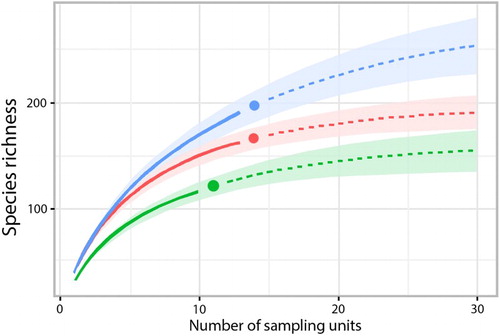
Figure 4. NMDS ordination plot of species composition in each Unit (Jaccard index, final stress = 0.1672). Red: Core Unit; blue: Transitional Unit; green: Satellite Unit. The Transitional Unit shows a much higher variance, almost completely involving the more compact convex hull of the core sites; whereas the Satellite Area has the most different faunal composition.
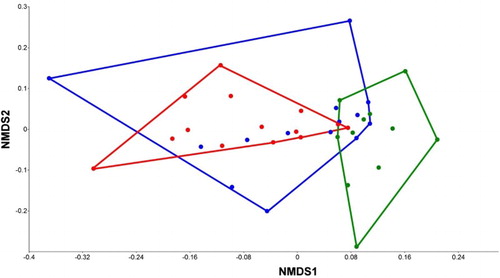
Table 1. Observed and estimated number of species using Chao 2 species richness estimator.
Figure 5. Taxonomic distinctness analyses of species composition of Units (all sampling sites were pooled for each Unit type). The Core Unit community is taxonomically more robust than in the other Units and had a higher delta+ than the average value. The Unit values did not significantly differ from the mean. Red: Core Unit; blue: Transitional Unit; green: Satellite Unit.
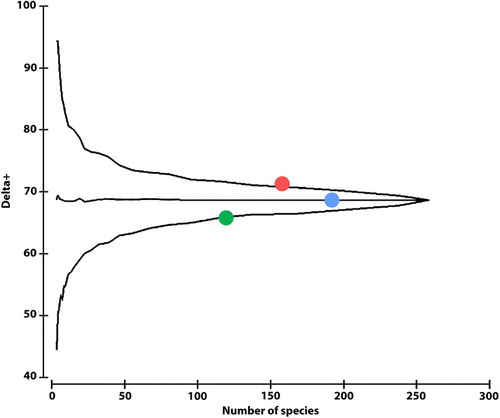
Figure 6. SDR-simplex plots of macroinvertebrate communities in each Unit (Core [CU], Transitional [TU], and Satellite [SU]). The metacommunity of the whole marsh (CU + TU + SU) is nearly random with a substantial equilibrium between beta-diversity features, such as replacement (R) and dissimilarity (D).
![Figure 6. SDR-simplex plots of macroinvertebrate communities in each Unit (Core [CU], Transitional [TU], and Satellite [SU]). The metacommunity of the whole marsh (CU + TU + SU) is nearly random with a substantial equilibrium between beta-diversity features, such as replacement (R) and dissimilarity (D).](/cms/asset/d573f263-d293-4e57-b9a6-a266d17e58f1/tinw_a_1461969_f0006_c.jpg)
Table 2. Results of the SDR simplex analysis. Mean scores of the measured similarity (S), richness difference (D), species replacement (R), beta diversity, and richness agreement among the individual sampling sites in the different Units (CU: Core Unit, TU: Transitional Unit, SU: Satellite Unit).
Figure 7. Traits of macroinvertebrates in each Unit. Different letters denote statistical significance (P ≤ 0.05), error bars represent standard error.