Figures & data
Figure 1. Functional responses from the Rogers’ random predator equation with 95% non-parametric bootstrapped (n = 999) confidence intervals for each tested group of crayfish: (a) both claws, (b) 1 claw, (c) clawless. Points represent raw data.
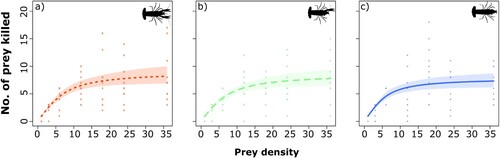
Figure 2. Non-parametric bootstrapped parameters (n = 999) for (a) attack rate and (b) handling time estimates from Rogers’ random predator equation with 95% confidence intervals considering each tested group of crayfish. Points represent the initial estimate from the random predator equation.
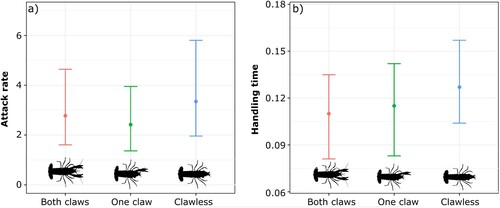
Table 1. First-order terms and p-values from logistic regression of prey killed as a function of prey density for each tested group and functional response parameters from the Rogers’ random predator equation per hour. Bold numbers indicate statistically significant values.
Figure 3. Rate of prey partially consumed (mean and standard error) for each prey density level (i.e., 1, 3, 6, 12, 18, 24, 36) and each tested group of crayfish. Circles represent crayfish with both claws, triangles represent crayfish with 1 claw, and squares represent clawless crayfish.
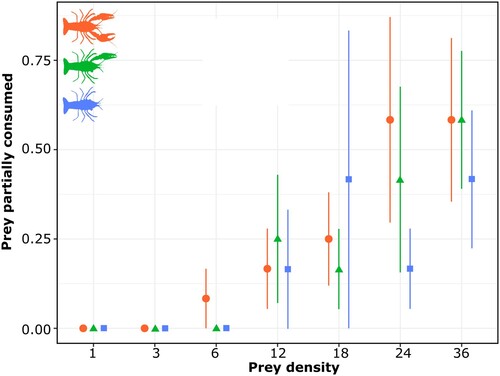
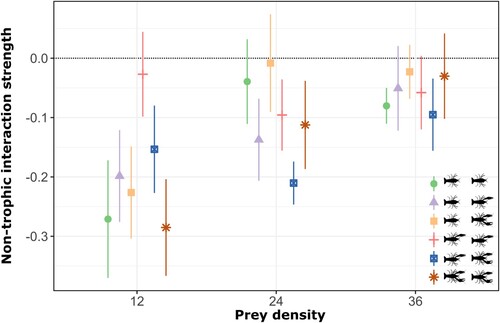
Figure 4. Non-trophic interaction strengths across each tested group of crayfish (i.e., both claws, 1 claw, and clawless) and prey densities. The error bars represent standard error. The dotted line indicates expected values in the absence of non-trophic effects. Each color and shape refer to each treatment evaluated in this study.