
Figures & data
Figure 1. Left: outline of Ottawa Sands Lake and the 3 sampling sites. Right: location of lake within Ottawa County and the lower peninsula of Michigan, USA.
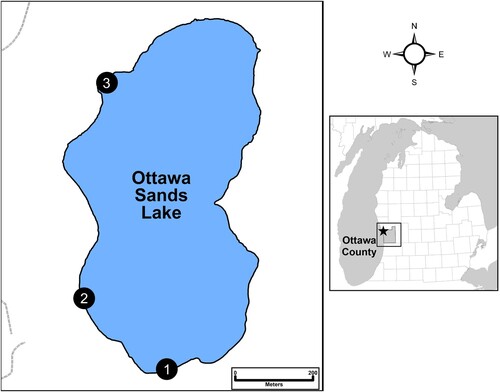
Table 1. Water quality data (mean and range values) collected from the 3 littoral sites and 1 pelagic site in Ottawa Sands Lake from June 2020 to July 2021. Total samples: littoral (n = 13); pelagic (n = 4).
Table 2. Nutrient data (mean and range values) collected from the 3 littoral sites and 1 pelagic site in Ottawa Sands Lake and nutrient data from other nearby lakes in west Michigan for comparison. Total samples: littoral (n = 13); pelagic (n = 4). BD = below detection (<5 µg/L); ND = not determined. Sampling dates: Ottawa Sands (July 2020, September 2020, April 2021, and July 2021); Muskegon Lake (May, July, September 2003–2005); Mona Lake (May–October 2002, February 2003, April–October 2003), Little Black Lake (August 2007), Spring Lake (July 2003).
Figure 2. (a) Soluble reactive phosphorus (SRP), (b) total phosphorus (TP), (c) nitrate (NO3-N), (d) ammonia (NH3-N), and (e) chlorophyll a (Chl-a) concentrations at the 3 sampling sites in Ottawa Sands Lake.
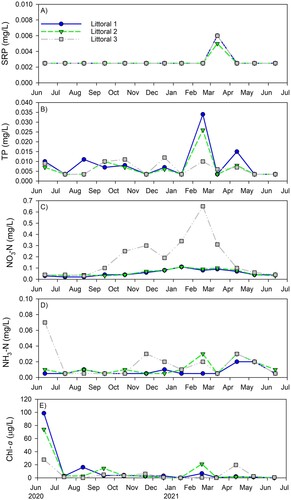
Table 3. Contrast of total macroinvertebrate individuals per square meter (density) in the caged (excluded) and uncaged (control) treatments for each site and season. Calculations include mean (SE, 1 standard error) and median (25th–75th quartile) for each of the 9 families that comprised 98% of the total abundance. No significant differences were detected among either sites or seasons (separately) based on the paired samples Wilcoxon test. Winter data were not available. N/A indicates an absence of taxa.
Table 4. Shannon-Wiener scores (exp(H’); diversity) for each site in Ottawa Sands Lake, Michigan across 3 seasons (9 months) and treatment type (caged vs. uncaged). Values are mean (SE, 1 standard error) for each site and n is the total number of sampling events per group. Based on a pairwise comparison of the estimated marginal means with a Bonferroni adjustment, no statistically significant differences were observed among caged vs. uncaged treatments. * denotes 1 winter sample, which brings the total to 46.
Figure 3. Non-metric multidimentional scaling (NMDS) ordination of macroinvertebrate community structure from the 3 sampling sites based on caged vs. uncaged treatment. OS = Ottawa Sands; SpCond = specific conductance; TDS = total dissolved solids; TP = total phosphorus; NO3 = nitrate; NH4 = ammonia; ODO = optical dissolved oxygen.
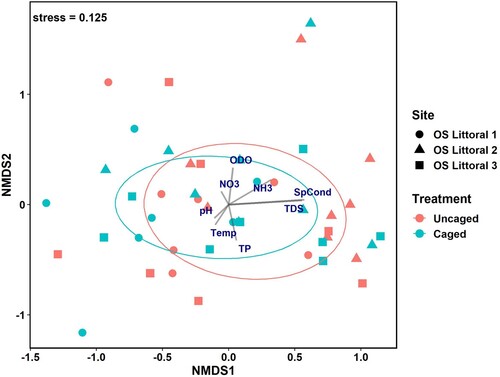
Figure 4. Non-metric multidimentional scaling (NMDS) ordination of macroinvertebrate community structure from the 3 sampling sites based on season. OS = Ottawa Sands; SpCond = specific conductance; TDS = total dissolved solids; TP = total phosphorus; NO3 = nitrate; NH4 = ammonia; ODO = optical dissolved oxygen.
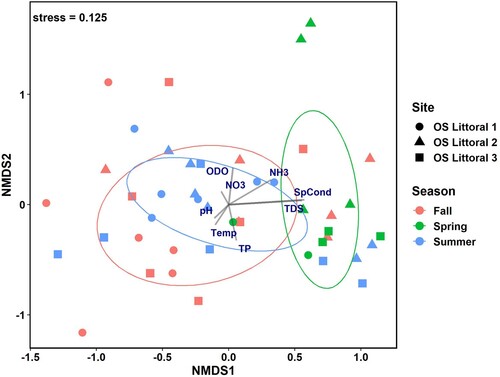
Table 5. Results from permutational multivariate analysis of variance (PERMANOVA) test using adonis for site (Littoral 1, 2, and 3), season (spring, summer, and fall), treatment (caged vs. uncaged), and interactions between both site and season as well as site and treatment. Values in bold indicate significant differences among groups.
Table 6. Average macroinvertebrate family abundances that account for at least 80% of the variance among sites and seasons based on the similarity to percentages (SIMPER) calculations from the non-metric multidimensional scaling (NMDS) analysis. Values in bold with an asterisk indicate significant (p < 0.05) differences in macroinvertebrate family between groups.