
Figures & data
Figure 1. The game’s colour space. Each colour is given its associated Hex code (as used by the app). Each of the game’s 32 colours is drawn from the CIE2000 colour space (see Luo et al., Citation2001), in constant perceptual distance to its left and right neighbours. This includes the first and last colour, meaning that the space is circular and can be represented as on the right. Figure adapted with permission from Morin et al. (Citation2020).
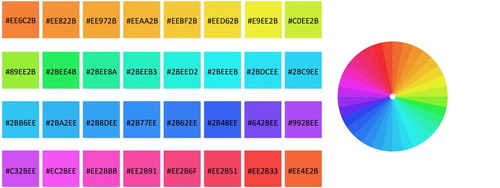
Figure 2. How colour arrays were built. Top row: The composition of two colour arrays, one marked by white dots, the other by black dots, is shown relative to the colour space. Bottom row: Six contiguous colour arrays (out of 32), including the white-dot and black-dot ones. Figure adapted with permission from Morin et al. (Citation2020).
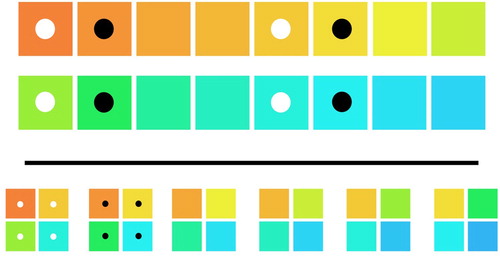
Figure 3. The 35 symbols used in the game (first four rows). Bottom row, in grey: the five symbols used for the tutorial and for advertising the game. Players were given a random set of 10 symbols at the start and could unlock the full set of 35 symbols by successfully playing the game. Figure adapted with permission from Morin et al. (Citation2020).
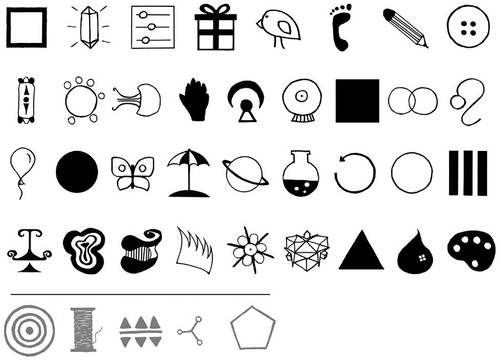
Figure 4. An example trial in synchronous mode. The sender in the current trial communicates with a receiver to help find the target colour (here, the brighter shade of blue), marked for the sender by a dot. Figure adapted with permission from Morin et al. (Citation2020).
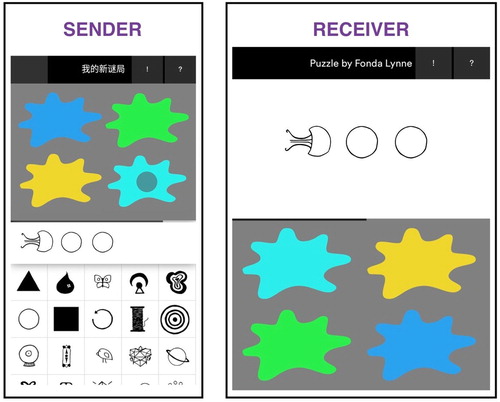
Figure 5. Colour terms used for the online survey in the three languages.
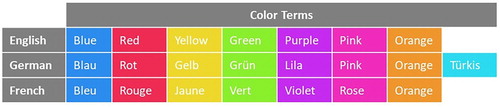
Figure 6. The colour wheel used in the online survey to gather baseline data for the semantic structure in native language colour terms. The example shows a participant in the English sample tasked with selecting the colours associated with the term “purple”. Colours were highlighted when moused over (like the one on the right side) and appeared at the top when clicked on, and their position on the screen was randomised while the circular order was maintained between participants.
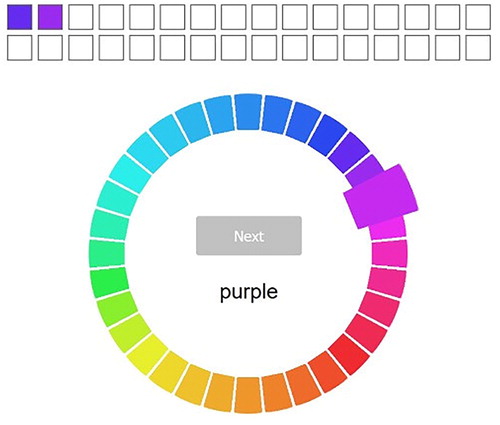
Table 1. Number of senders and same-language pairs that reached the preregistered thresholds of trials for each of the 5 languages we intended to use.
Figure 7. Visualisations of the categorical structure resulting from the EFA on the data of the online survey. Boxes represent the 32 colours used in our study. Circles represent categories, named with the term that was most frequently associated with the colours loading on them; these categories are coloured in the hue that has the highest loading. Arrows are drawn for all factor loadings (= the numbers on the arrows) in the EFA that are .3 or higher. Top left: English data. Top right: German data. Bottom left: French data, 7-factor-structure. Bottom right: French data, 8-factor-structure.
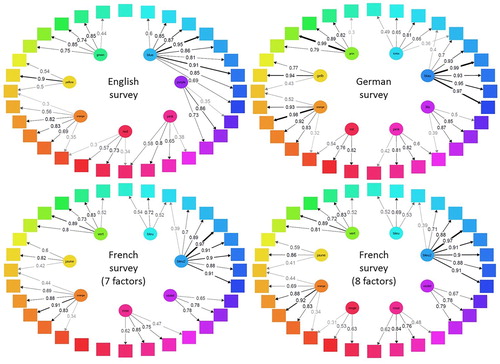
Table 2. Goodness of fit measures (robust estimates) for the CFA on the three languages.
Table 3. AIC values and p-values of the likelihood-ratio tests computed from the models testing the effect of the number of boundaries on performance. “Negative” in the ΔAIC column implies the simpler model minimised the AIC and was favoured over the model including the number of boundaries.
Table 4. AIC values and p-values of the likelihood-ratio tests computed from the models testing the effect of the presence of a same-category distractor on the number of symbols sent in the given trial.
Table 5. AIC values and p-values of the likelihood-ratio tests computed from the models testing the effect of the presence of a same-category distractor on performance in a given trial. Note the additional column for the AIC including the interaction effect between the distractor variable and the number of trials a pair had played together, and thus the two values for the ΔAIC and likelihood-ratio test columns: The first number indicates the value for the comparison between the simplest model and the model including the main effect, and the second the value for the comparison between the model including the main effect and the model including the interaction effect.
Table 6. AIC values and p-values of the likelihood-ratio tests computed from the models testing the effect of same-language vs. different-language pairs on performance in the given trial.
Data availability statement
The data that support the findings of this study are openly available in the Open Science Framework at https://doi.org/10.17605/OSF.IO/A8BGE.