
Figures & data
Table 1. A summary of studies that have investigated the existence of a negative footprint illusion, indicating that the illusion is robust across most judgment tasks, dependent measures and study designs.
Figure 1. Carbon footprint estimates given by the participants in the control condition and experimental condition. Error bars represent the standard error of the mean.
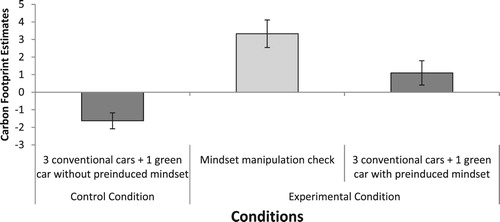
Figure 2. Carbon dioxide emission estimates given by the participants in the control condition and experimental condition. Error bars represent the standard error of the mean.
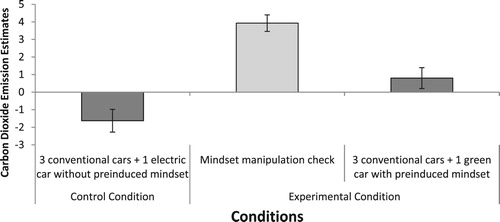
Table 2. Mean age in years (and SD) of the participants in each condition in Experiment 2, also showing the percentage of female participants across conditions.
Figure 3. The graphic used to depict a single petrol car. The number of cars displayed to participants corresponded with the information described in each method section.
Figure 4. The graphic used to depict a single electric car. The number of cars displayed to participants corresponded with the information described in each method section.
Table 3. The number of petrol cars and electric cars in the six priming tasks across conditions.
Figure 5. The graphic used to depict a single existing house in the residential area. The number of houses displayed to participants corresponded with the information described in each method section.

Figure 6. The graphic used to depict a single new additional house in the residential area. The number of houses displayed to participants corresponded with the information described in each method section.

Table 4. The number of existing houses and additional new houses in the six priming tasks across conditions.
Table 5. Manipulation check for each priming condition in Experiment 2, showing the mean response (and SE) when fuel cost is the dependent measure.
Figure 7. Carbon footprint estimates for all priming conditions in Experiment 2. Error bars represent the standard error of the mean.
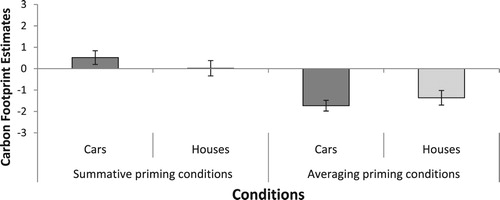
Table 6. Mean age in years (including SD) of the participants in each condition in Experiment 3, also showing the percentage of female participants across conditions.
Table 7. Manipulation check for each priming condition in Experiment 3, showing the mean response (and SE) when income is the dependent measure.
Figure 8. Carbon footprint estimates for all priming conditions in Experiment 3. Error bars represent the standard error of the mean.
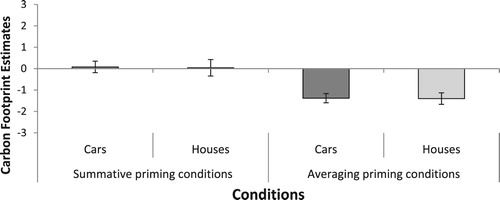
Table 8. Mean age in years (including SD) of the participants in the two condition in Experiment 4, also showing the percentage of female participants across conditions.
Table 9. Percentages of participants susceptible to the negative footprint illusion and the zero footprint illusion and percentage of participants that was not susceptible to either illusion (i.e. responding correctly).