
Figures & data
Figure 1. The Four Types of Prediction Patterns Used in the Decision Trials. Note. The rows contain the predictions of the three cues differing in cue validity (p = .56; .56; .86). Each cue makes outcome predictions (1 = gain; 0 = no gain) for the three options depicted at the top of each column.
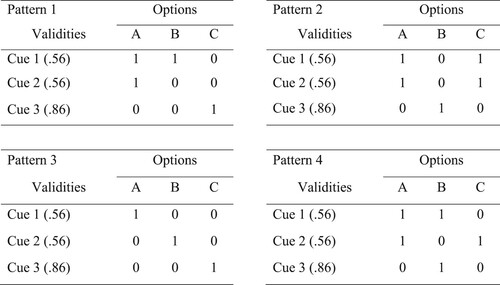
Figure 2. Decision Within the Open Information Matrix. Note. The houses represent the decision options. The three persons are the cues. The red dots next to them are their cue validities, displayed as “smart circles”. In the open matrix, all predictions are visible (in the closed matrix, which is not depicted here, the predictions are covered by the grey doors and can be opened via mouse-click). Participants make their decision by clicking on one house. Then, either a treasure or a spider appears in the house. The circles at the top represent the treasure points. They become coloured with every treasure found. Every treasure is traded into a monetary gain, whereas a spider yields no gain.
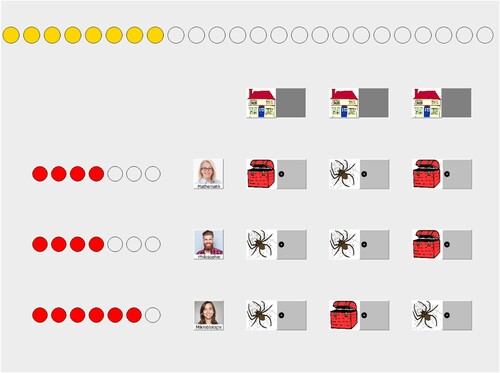
Table 1. Descriptive Statistics of Accurate Decisions by Patterns.
Table 2. Descriptive Statistics of Accurate Decisions by Patterns Dependent on Presentation Format.
Table A Means and Standard Deviations of Accurate Decisions by Research Field
Data availability statement
The data that support the findings of this study and the preregistration are openly available on the OSF: https://osf.io/z2cha/