
Figures & data
Table 1. Overview of all hypothesised effects of Experiment 1 and 2.
Figure 1. Translated example tweets from filler and experimental trials from Experiment 1.

Table 2. Estimated coefficients, standard errors, degrees of freedom, and t values for the linear mixed model of the reading times in Experiment 1.
Figure 2. Mean reading times with ±1 standard error of Experiment 1 and 2 by experimental condition.
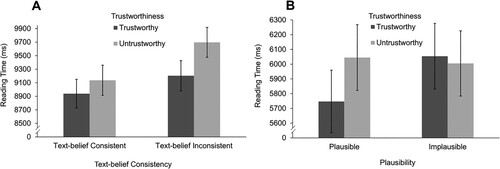
Table 3. Estimated coefficients, standard errors, degrees of freedom, and t values for the linear mixed model of the plausibility ratings in Experiment 1.
Figure 3. Mean plausibility ratings with ±1 standard error of Experiment 1 and 2 by experimental condition.
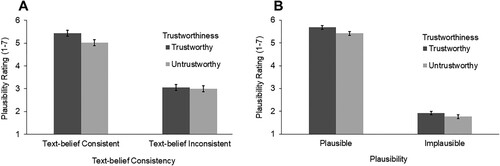
Figure 4. Mean source credibility ratings with ±1 standard error of Experiment 1 and 2 by experimental condition.
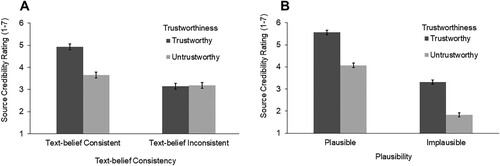
Figure 5. Translated example tweets from experimental trials from Experiment 2.
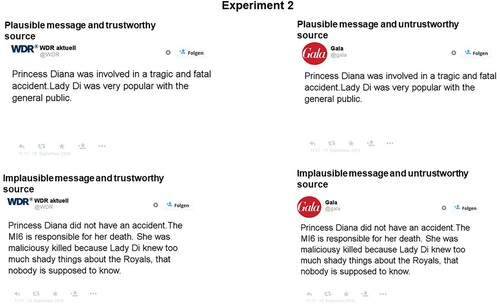
Table 4. Estimated coefficients, standard errors, degrees of freedom, and t values for the linear mixed model of the reading times in Experiment 2.
Table 5. Estimated coefficients, standard errors, degrees of freedom, and t values for the linear mixed model of the plausibility ratings in Experiment 2.
Data availability statement
The experimental texts, data files, and R-scripts for the full and additional analyses are available (https://osf.io/r5bgx/). The reported experiments were not preregistered.