Figures & data
Figure 1. Mean CO2 emission estimates after 10 “green” buildings have been added to a set of 30 conventional buildings (small addition condition) and mean CO2 emission estimates after 150 “green” buildings have been added to a set of 30 conventional buildings (large addition condition). Error bars represent standard error of the means.
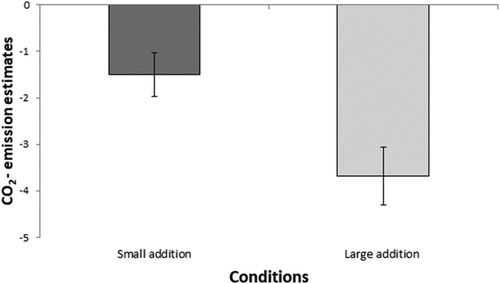
Figure 2. Mean CO2 estimates after 10 “green” buildings have been added to a set of 30 conventional buildings (small addition condition) and mean CO2 emission estimates after 150 “green” buildings have been added to a set of 30 conventional buildings (large addition condition). Error bars represent standard error of the means.
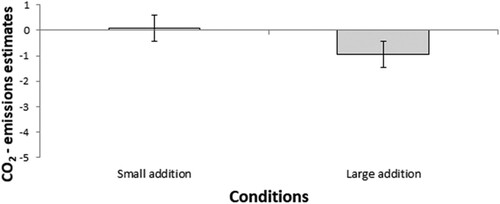
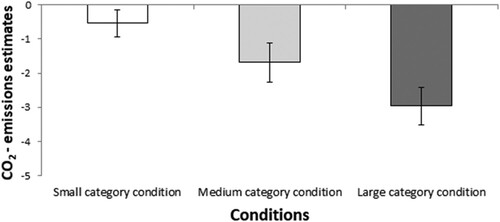
Figure 3. Mean CO2 emission estimates when 1 “green” building is added to 4 conventional buildings (the small category condition), when 10 “green” buildings are added to 40 conventional buildings (the medium category condition), and when 100 “green” buildings are added to 400 conventional buildings (the large category condition). Error bars represent standard error of the means.