
Figures & data
Figure 1. Overview of the conditions and procedures in Experiment 1. Each participant estimated pinc (probability of inclusion) for five problems (Q1–Q5). The topics of Q1–Q4 varied across conditions. The original questions were in Japanese. q, prevalence presented in the problems. n, group size presented in the problems. N, sample size.
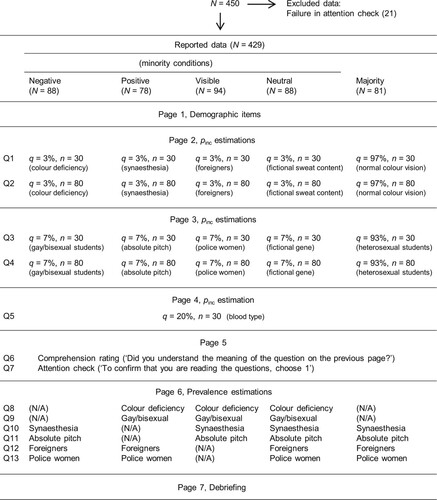
Table 1. The topics used in Experiment 1 and the results of the prevalence estimation task. The prevalence of each topic was estimated by the Experiment 1 participants who did not see the topic in the preceding pinc problems (see ). Medians of the estimated prevalence are shown with 95% CIs. The actual prevalence values were adopted from the references. In reality, it is often impossible to determine the prevalence of the traits definitively. These traits have a wide continuum of individual differences and may even be multidimensional (Bermudez & Zatorre, Citation2009; Bosten, Citation2019; Epstein et al., Citation2012; Simner, Citation2012).
Figure 2. Results of Experiment 1, participants’ estimates of the probability of inclusion (pinc) at various settings of q and n. A histogram of the estimated pinc for the blood type problem (Q5) is shown in a. The blood type problem was presented to all the participants of Experiment 1. The results of the other four pinc problems (Q1–Q4) of the conditions other than the Majority condition are shown in b to e. The topics used in these problems varied among the conditions. The results of the Majority condition are shown in f to i. Estimates less than 0 or larger than 100 are not shown in this figure. q, prevalence presented in the problems. n, group size presented in the problems. N, sample size. EV, expected value.
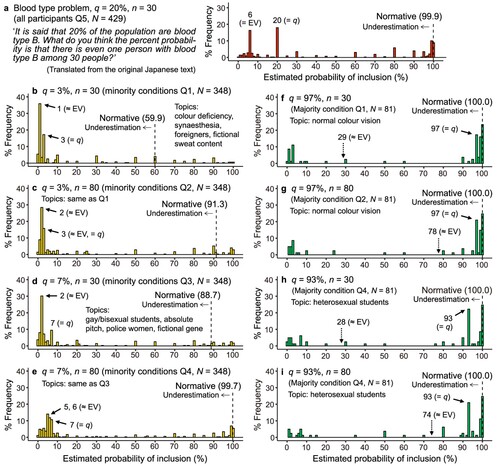
Table 2. Descriptive statistics of the estimated probability of inclusion in Experiments 1 and 2. Prevalence (q) and group size (n) were presented in the problems. Underestimation was defined as estimates less than the normative pinc (probability of inclusion) for each problem.
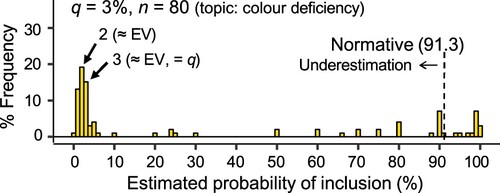
Figure 3. Results of Experiment 2, the estimated probability of inclusion for the student sample. Students (N = 48) with PCs estimated the probabilities of inclusion for four problems (Q1–Q4) identical to those in the Negative condition of Experiment 1 (colour deficiency problems, gay/bisexual student problems). Estimates larger than 100 are omitted in this figure. EV, expected value. q, prevalence presented in the problems. n, group size presented in the problems.
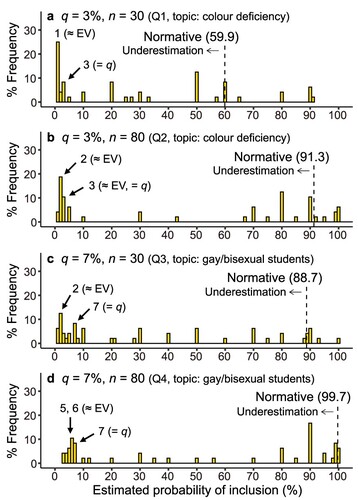
Figure 4. Overview of the conditions and procedures in Experiment 3. The content of the critical question (Q2) varied between the conditions. The original questions were in Japanese. q, prevalence presented in the problems. n, group size presented in the problems. N, sample size.
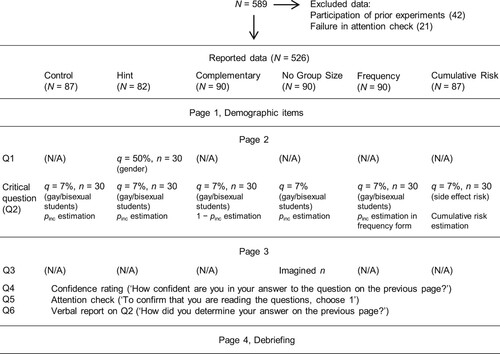
Figure 5. Results of Experiment 3 critical question (Q2). In the Control condition, (a) the participants estimated pinc for q = 7% and n = 30 (Q2, gay/bisexual student problem with revised wording). For reference, b shows the result of the gender problem (Q1), which appeared only in the Hint condition. The results of the Control condition are plotted together with the results of the other conditions (c, e, f, and g) for comparison purposes. EV, expected value. q, prevalence presented in the problems. n, group size presented in the problems.
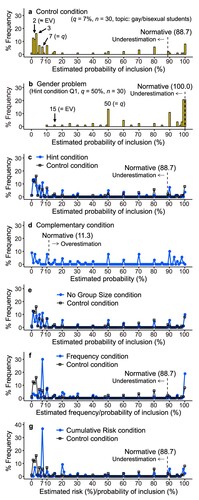
Table 3. Percentage frequency of the heuristics used in Experiments 2 and 3. The analyses of the estimates and participants’ retrospective verbal reports identified seven heuristics used in the estimation tasks in Experiments 2 and 3. Raw frequencies are in parentheses. In Experiment 3, the frequency of the heuristics was compared between the Control (pinc estimation) and Cumulative Risk conditions.
Figure 6. Results of Experiments 4a and 4b. Each participant estimated pinc for a real group of people in the classroom. The only difference between the two experiments was n (i.e. the group size presented in the problems). EV, expected value. q, prevalence presented in the problems. N, sample size.
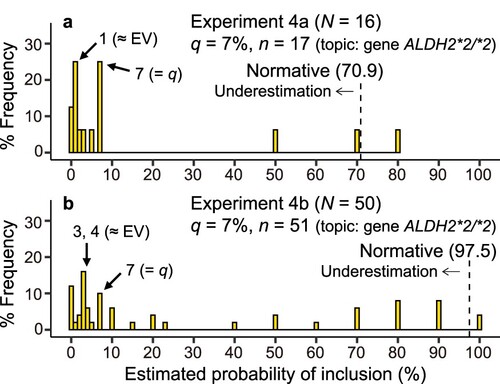
Figure 7. Results of Experiment 5. The participants provided their attitude ratings twice, namely, before (blue plot) and after (red plot) a middle task. The vertical axis represents the attitude score (the average of the three rating items). A high attitude rating score indicated strong agreement with the inclusive statements on colour deficiency. The middle task varied by condition: pinc estimation (a), EV estimation (b), and reading about the normative pinc value and rating how believable the value was (c). The open dots with thin lines represent the participants’ scores and the filled dots with thick lines represent the averages. The p-values were adjusted for the triplet of t-tests. EV, expected value.
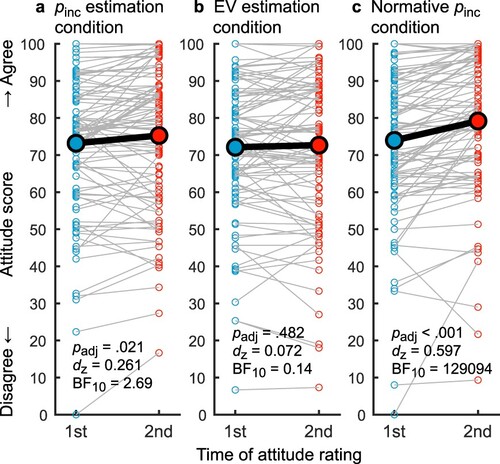
Table A1. Results of Experiment 3 critical questions (Q2). Prevalence (q) and group size (n) were presented in the problems. Underestimation was defined as estimates less than the normative answer for each problem.
Figure A1. Results of the middle task of the pinc estimation condition (N = 99), Experiment 5.
Supplemental Material
Download MS Word (56.7 KB)Data availability statement
Anonymized data, questionnaires, and analysis code are publicly available at Open Science Framework repository, https://doi.org/10.17605/OSF.IO/GXWN7
.