Figures & data
Table 1. Properties of COB, JOB, WOB, and DF at 30°.
Table 2. Technical parameters of diesel engine D243.
Figure 1. A fuel supply system-mounted- filter coupling to D243 diesel engine.
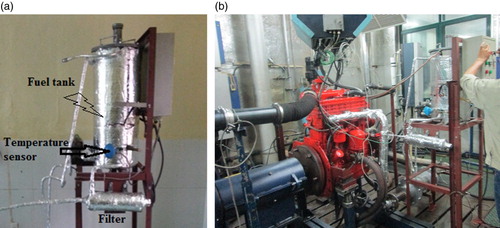
Figure 2. The dependence of density on COB fraction.
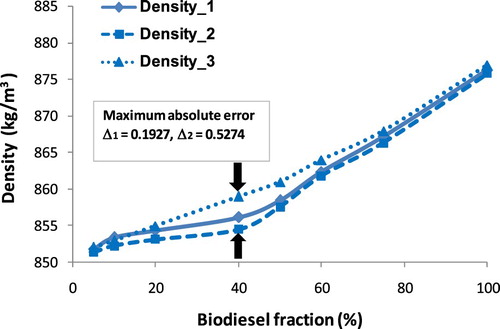
Figure 3. The dependence of density on JOB fraction.
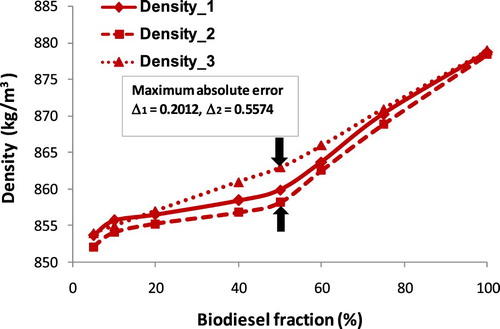
Figure 4. The dependence of density on WOB fraction.
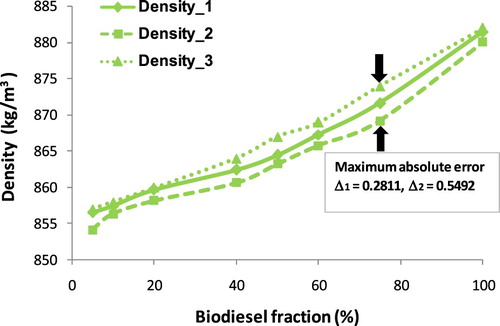
Table 3. Measurement and calculation methods for biodiesel blend density at 30°C.
Figure 5. The relationship between density and fraction of three studied biodiesel types (a), the regression correlation of experimental values (b).
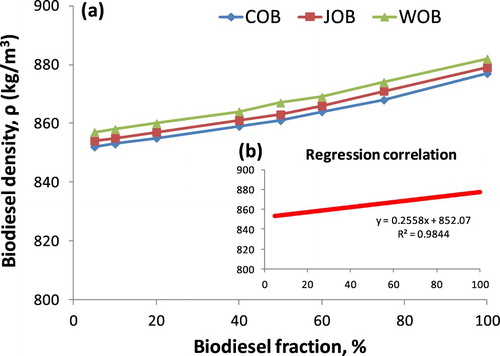
Figure 6. The relationship between density of three types of pure studied biodiesels and temperature (a), the regression correlation of experimental values (b).
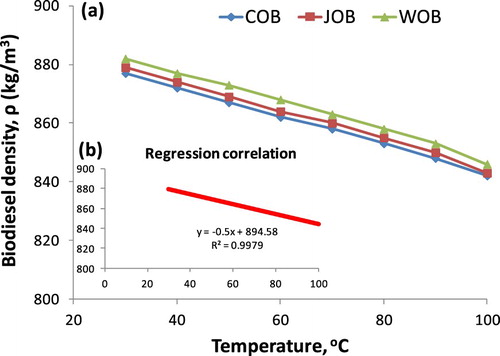
Figure 7. The relationship between KV and studied biodiesel fraction.
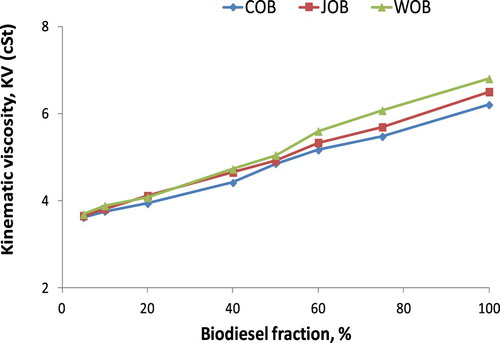
Figure 8. The dependence of kinematic viscosity on COB fraction.
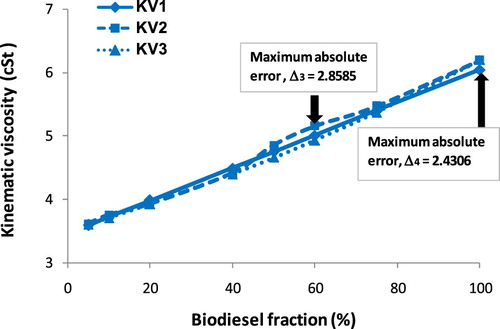
Figure 9. The dependence of kinematic viscosity on JOB fraction.
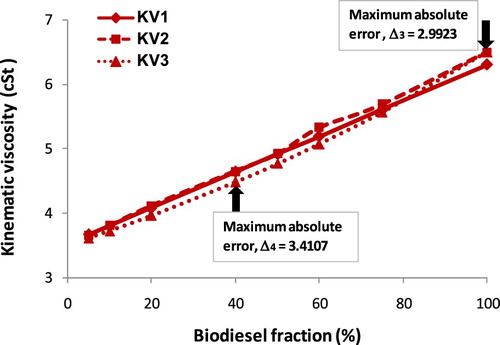
Figure 10. The dependence of kinematic viscosity on WOB fraction.
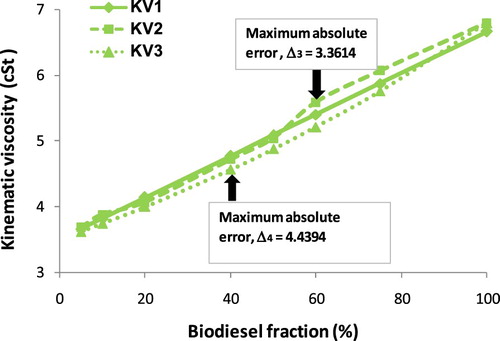
Table 4. KV values of biodiesel blends at 30°C.
Figure 11. The relationship between KV and temperature of three studied biodiesel types.
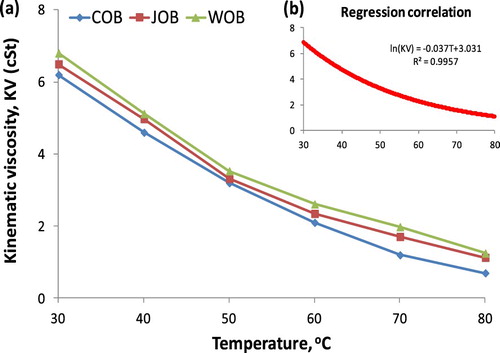
Figure 12. KV and density of three studied biodiesel types with fraction variation.
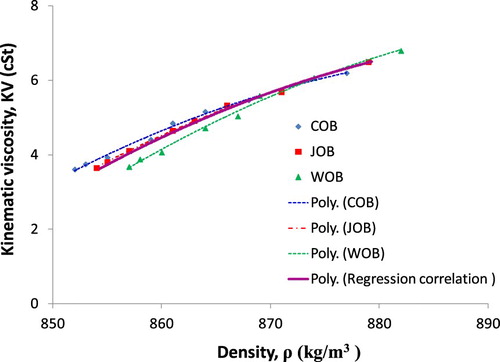
Figure 13. KV and density of three studied biodiesel types with temperature variation.
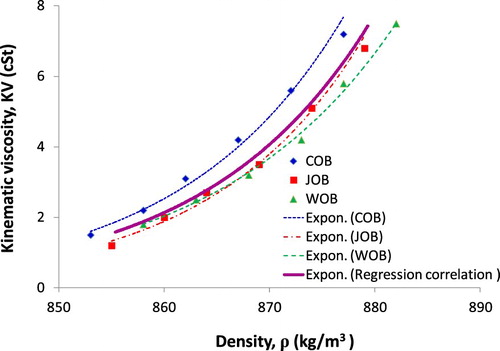
Figure 14. The relationship of FR through filter and time at different values of kinematic viscosity.
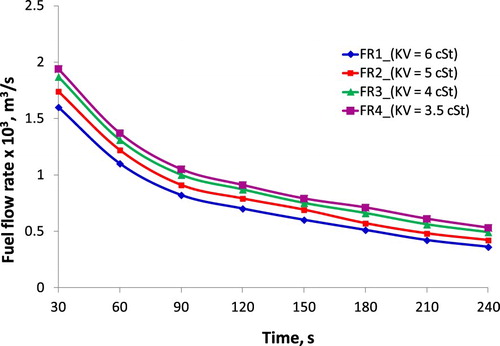
Table 5. Hf characteristics of the fuel pump at different values of kinematic viscosity.
Figure 15. SMD as a function of KV at a different revolution of the test engine.
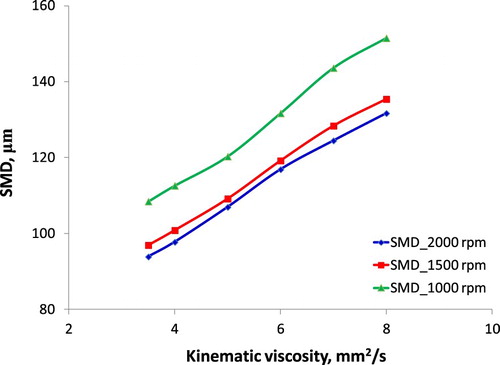
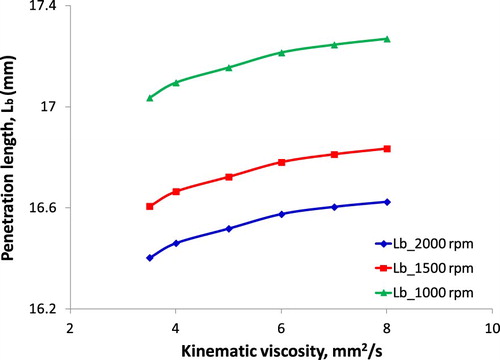
Figure 16. Penetration length as a function of KV at a different revolution of the test engine.