Figures & data
Figure 1. The normal cloud model indicating ‘Youth’.
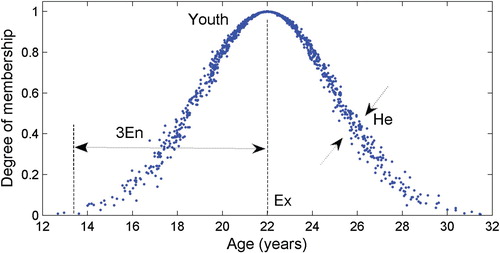
Figure 2. Cloud generators (left: the forward cloud generator; right: the backward cloud generator).
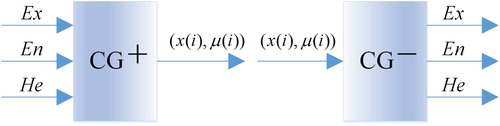
Table 1. Relationship between linguistic and numerical variables.
Table 2. The golden section based algorithm for calculating the parameters of five benchmark RCMs.
Figure 3. Reference scale: appearances of benchmark RCMs corresponding to the five linguistic terms.
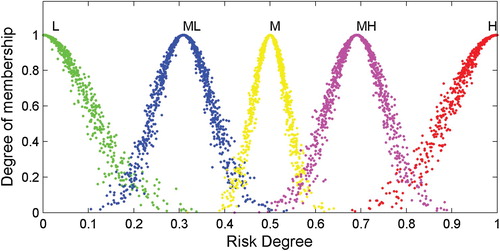
Table 3. Reference scale: parameters of benchmark RCMs corresponding to the five linguistic terms.
Table 4. An example questionnaire: the core part.
Figure 4. Step-wise approach to risk evaluation of NNEt by using the RCM.
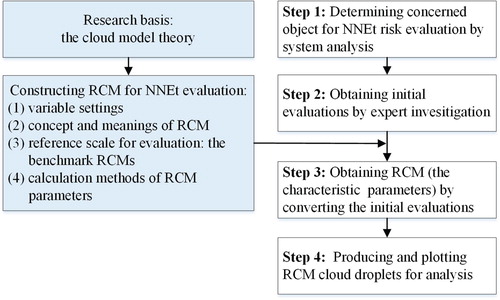
Figure 5. The specific area of interest.
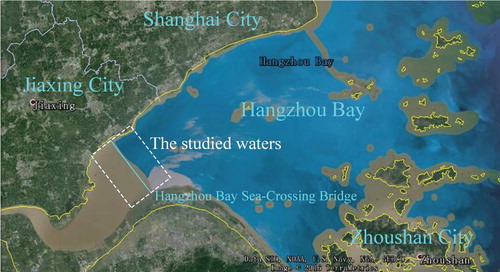
Table 5. System analysis and the concerned object.
Table 6. The initial qualitative risk evaluation of the concerned objects by 20 experts.
Table 7. Final RCM of the concerned object.
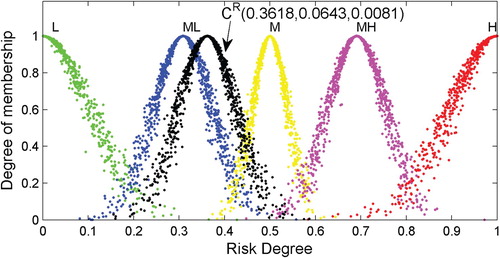
Figure 6. RCM appearance of the object ‘Wind’.
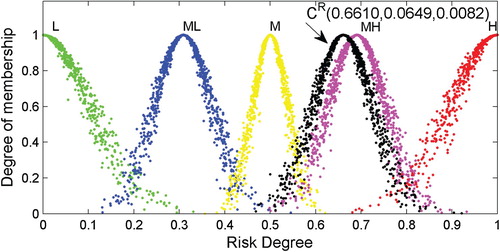
Figure 7. RCM appearance of the object ‘Current’.
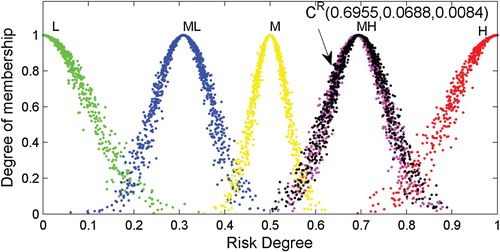
Figure 8. RCM appearance of the object ‘Fog and visibility’.
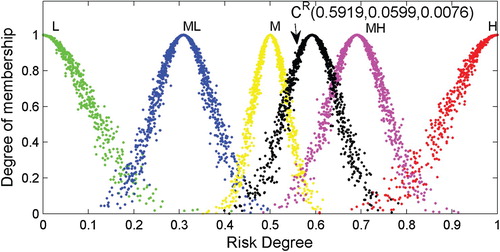
Figure 9. RCM appearance of the object ‘Channel width’.
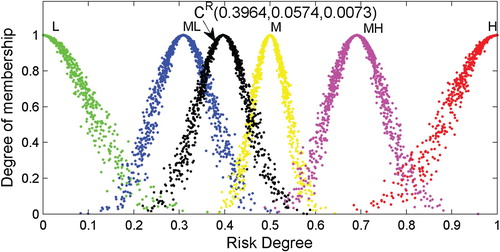
Figure 10. RCM appearance of the object ‘Channel water depth’.
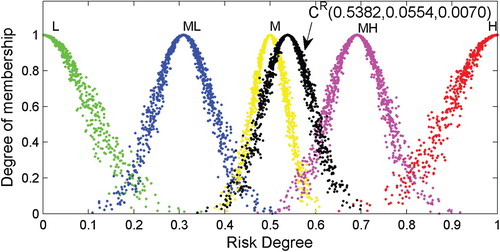
Figure 11. RCM appearance of the object ‘Shipping route cross’.
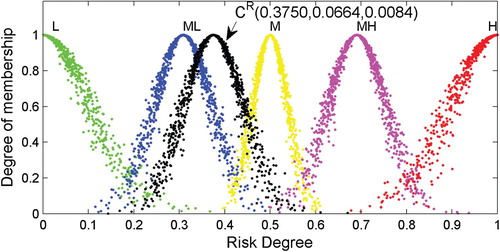
Figure 12. RCM appearance of the object ‘Ship traffic flow volume’.
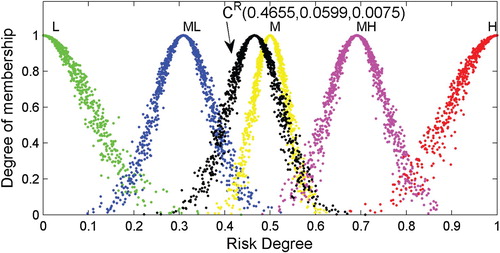
Figure 13. RCM appearance of the object ‘Obstacles to navigation’.
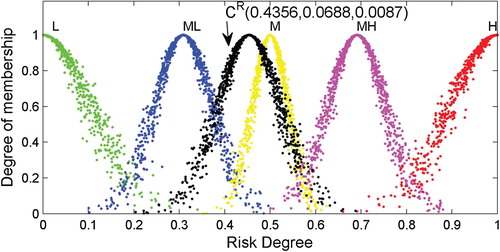
Figure 14. RCM appearance of the object ‘Navigational aids’.