Figures & data
Figure 1. Simulink model of the centrifugal pump.
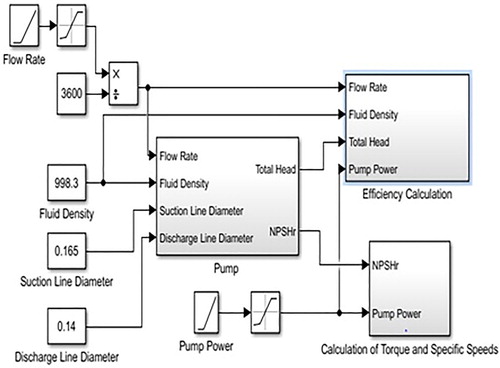
Table 1. Properties of chemicals used in the model (IMO Citation2016; Pillon Citation2007).
Table 2. ANN model specifications.
Figure 2. Basic structure of the network.
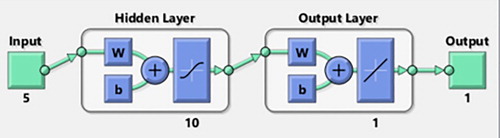
Figure 3. The architecture of selected ANN in the performance estimation.
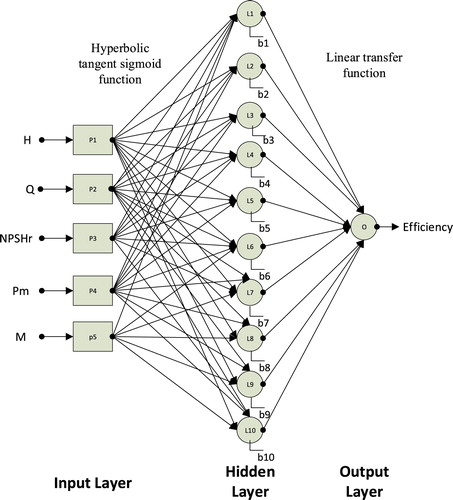
Table 3. Model outputs at the optimum flow rate.
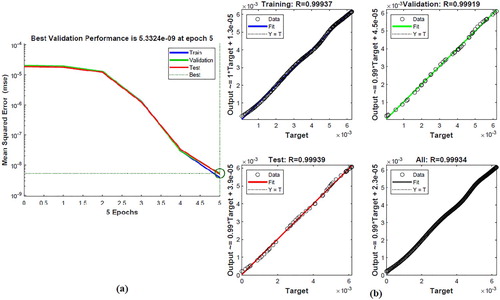
Figure 4. Results of ANN with water’s dataset: Validation performance (a) Regression analysis graphics (b).
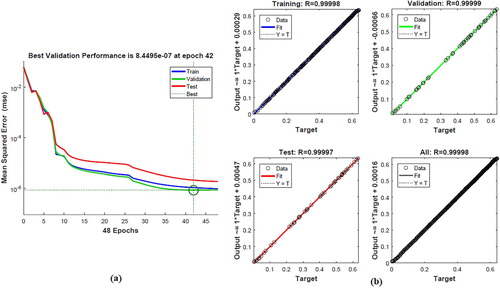
Table 4. ANN data and errors for water.
Figure 5. Results of ANN with ethyl alcohol’s data set: Validation performance (a) Regression analysis graphics (b).
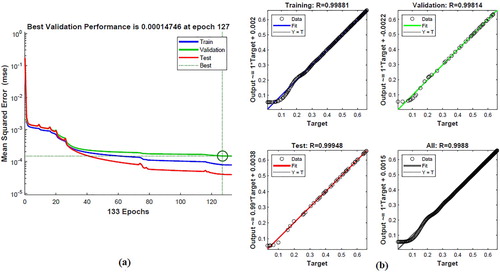
Table 5. ANN data and errors for ethyl alcohol.
Figure 6. Results of ANN with n-propyl alcohol’s data set: Validation performance (a) Regression analysis graphics (b).
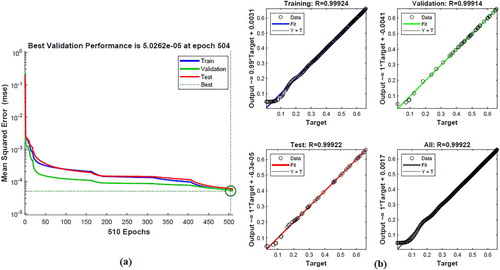
Table 6. ANN data and errors for n-propyl alcohol.
Figure 7. Results of ANN with phenol’s data set: Validation performance (a) Regression analysis graphics (b).
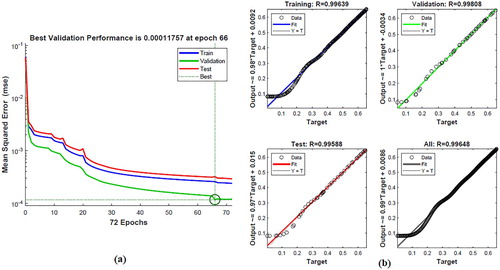
Table 7. ANN data and errors for phenol.
Figure 8. Results of ANN with chloroform’s data set: Validation performance (a) Regression analysis graphics (b).
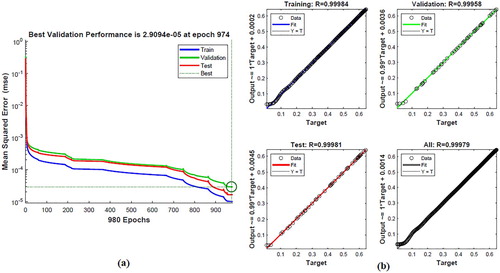
Table 8. ANN data and errors for chloroform.
Figure 9. Results of ANN with castor oil’s data set: Validation performance (a) Regression analysis graphics (b).
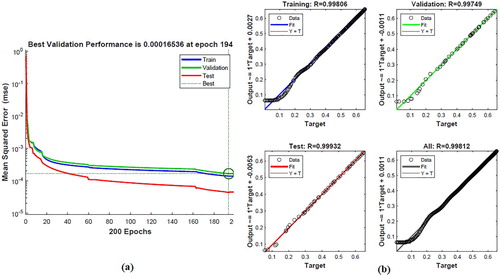
Table 9. ANN data and errors for castor oil.
Figure 10. Results of ANN with nitric acid’s data set: Validation performance (a) Regression analysis graphics (b).