Figures & data
Table 1 Anthropometric Z-scores
Figure 1 Distribution of HC Z-scores (n = 3652). The pooled HCZ scores are plotted against the number of measurements obtained, demonstrating a normal distribution.
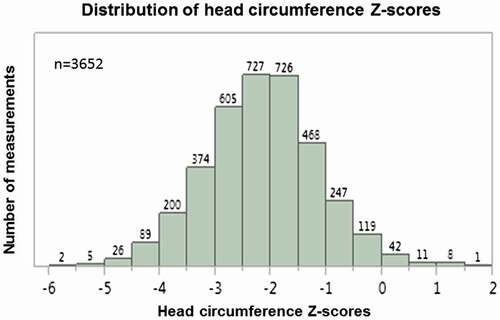
Figure 2 Anthropometric Z-scores by age group. Z-scores for height (dark grey), weight (light grey) and HC (black) are shown by age group and gender. The solid lines show results for boys and girls together; results for girls are shown in the dashed lines, for boys in the dotted lines. Results for each age group (indicated for HAZ by b, for HCZ by d, for WAZ by f and g) were compared with that of the youngest children (indicated for HAZ by a, for HCZ by c, for WAZ by e). For clarity, only the P-values for boys and girls together are shown. For both height-for-age Z-score (HAZ) and head circumference-for-age Z-score (HCZ), results for children in older age groups were significantly lower (P < 0.0001) than for the children in the youngest age group (6–12 months). For weight-for-age Z-score (WAZ), older children also had significantly lower measurements than younger children (6–12-month-olds compared with 13–24-month-olds and 25–36-month-olds, P < 0.0001; 6–12-month-olds compared with the older age groups, P < 0.001).
Table 2 HCZ related to gender, age and other anthropometric measurements
Table 3 HCZ related to ASF consumption by age group
Figure 3 Number of animal-source foods consumed and HCZ. In children aged <36 months, the number of animal-source foods consumed related to HCZ (P < 0.0001).