
Figures & data
Table 1. PAC and ABC scores at admission, discharge and follow-up, with reliable change index (RCI).
Figure 1. Number of SIB episodes for each day during the admission. The figure was made using SPSS version 25.
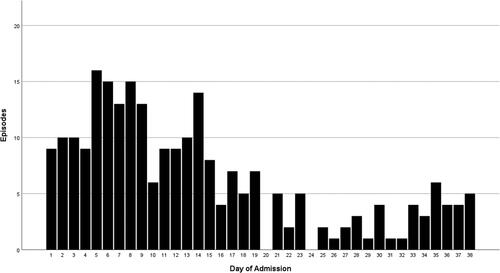
Table 1. PAC and ABC scores at admission, discharge and follow-up, with reliable change index (RCI).
Figure 1. Number of SIB episodes for each day during the admission. The figure was made using SPSS version 25.