
Figures & data
Table 1. Overview of stakeholder interaction activities that served as input for IMS diagram development. The numbers of the activities (1a to 7d) listed in this table appear in .
Figure 1. Map of interaction activities with stakeholders for the development and validation of the systems diagram. The numbers 1a,b,c to 7 a,b,c refer to the stakeholder engagement activities listed in , e.g., 1a is a stakeholder interview with Médecins sans Frontières in Brussels. The concentric rings, with the resulting IMS diagram in the centre, indicate the system levels at which the stakeholder operates, or has his or her expertise. The four outer orientations (Vaccine supply, Humanitarian operations, Immunisation demand and Healthcare system) refer to the main background of the stakeholders. One activity can appear at different locations, for example, a group model building session with stakeholders with different backgrounds. The grey arrows show the iterative, multi-level knowledge build-up while the black arrows indicate how this knowledge flows to and from the IMS diagram under construction.
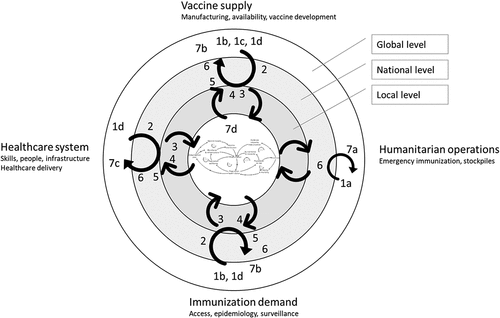
Figure 2. Aggregated system diagram highlighting two paradigms: planned and emergency immunisation.
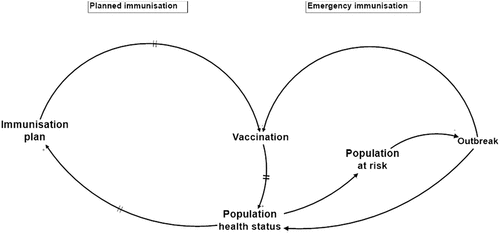
Figure 3. Three flows that need to be synchronised for high IMS performance, make up the focal point of the IMS: Child (Population wellbeing), Nurse (Workforce & infrastructure), and Vaccine (Vaccine distribution).
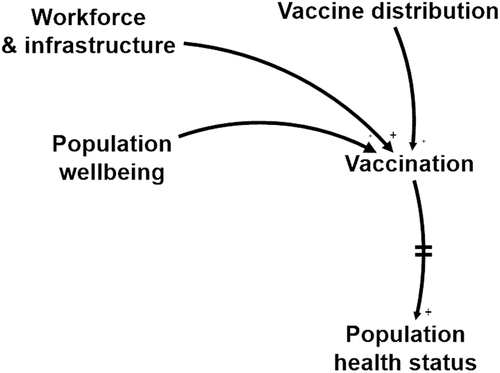
Table 2. Brief explanation of the feedback loops in the IMS diagram. A detailed explanation can be found in Annexe 1.
Figure 4. IMS diagram: Aggregated causal-loop diagram of IMS in a LMIC. Applicable to national, subnational level and local settings.
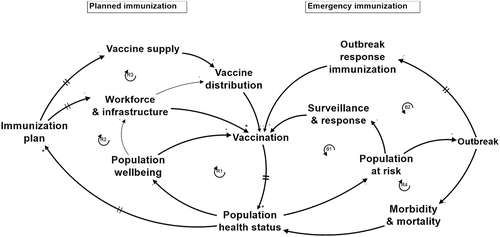
Figure 5. Stakeholders mapped on the generic LMIC IMS diagram.
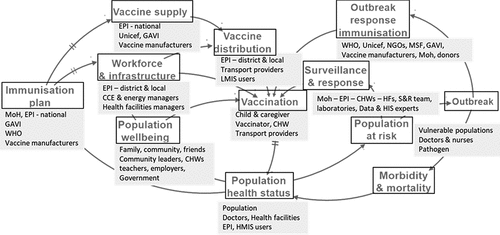
Figure 6. System assessment of local settings derived from cases in Rwanda: rural area (top) and peri-urban area (bottom) with respect to measles. Mechanisms that are active, are shown as red or green loops when they have a, respectively, negative or positive impact on the IMS performance. Mechanisms that are not active at the moment of assessment, such as international emergency immunisation mechanisms (B2), are shown as black loops on the IMS model.
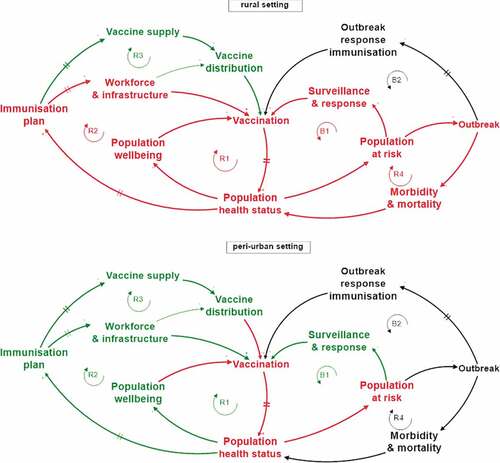
Figure 7. Factors determining sustainability of the IMS: endogenous factors (green) and exogenous factors (blue). Exogenous resilience factors of the IMS are red.
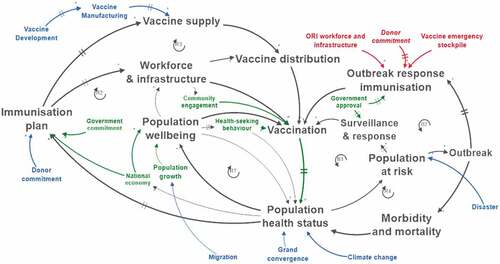
Table 3. Examples of immunisation system leverage points classified according to Malhi et al. (Citation2009) based on Meadows (1989).