Figures & data
Figure 1. Flow diagram of the literature review search process.
Figure 2. Number of papers by their year of publication (up to 2021).
Figure 3. Number of papers by their JCR category. Papers with an ISSN not within any of the six JCR categories have been classified within ‘other’.
Figure 4. Number of papers by their JCR category and the Scopus search they were identified.
Figure 5. Number of papers by their continent of application.
Figure 6. Number of papers by their funding source.
Figure 7. Number of papers by the Trauma and orthopaedics specialties they consider.
Figure 8. Number of papers by their care area within the care system.
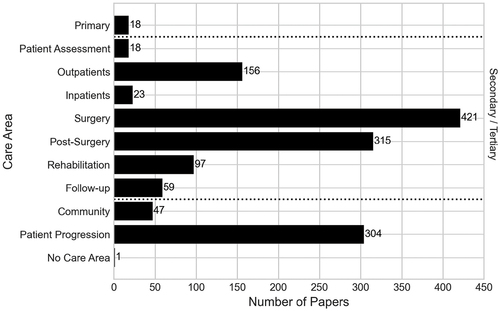
Figure 9. Number of papers by the number of parts of the secondary/tertiary pathway that they have modelled.
Figure 10. Number of papers by their modelling perspective.
Figure 11. Number of papers by their planning decision level.
Table 1. Number of papers by their JCR category and planning decision level.
Figure 12. Number of papers by research aims.
Figure 13. Number of papers by their research outcomes.
Figure 14. Number of papers by the level of implementation in a real world setting.
Figure 15. Number of papers by their research aims and level of implementation.
Figure 16. Number of papers by how the data was obtained.
Table 2. Number of papers by their level of implementation and how the data was sourced.
Figure 17. Number of papers by their primary OR/MS method area.
Table 3. Breakdown of papers by their primary OR/MS area, as well as the frequency of methods used within each OR/MS area. It should be noted that some papers applied more than one primary OR/MS method in their paper.
Figure 18. Number of papers by their year published for the four most applied OR/MS areas (Markov models, decision analysis, soft OR, simulation).
Figure 19. Number of papers by their primary OR/MS method area and level of implementation.
Figure 20. Violin plots showing the distribution of the number of secondary/tertiary care areas modelled by each primary or area.
Figure 21. Number of papers by their research outcomes and primary OR/MS method.