
Figures & data
Figure 1. Approaches to using data in digital health design ordered by time and complexity of data practices.
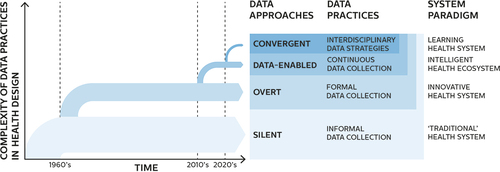
Figure 2. Use of data in silent approaches to digital health design depicted on a flowchart diagram.
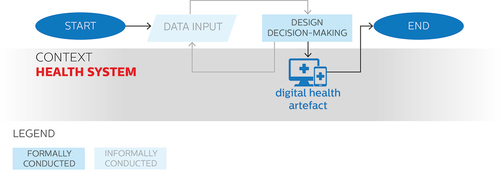
Figure 3. Use of data in overt approaches to digital health design depicted on a flowchart diagram.
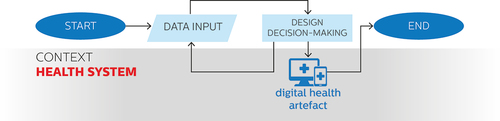
Figure 4. Use of data in data-enabled approaches to digital health design depicted on a flowchart diagram.
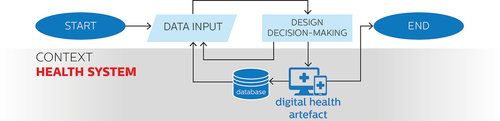
Figure 5. Use of data in convergent approaches to digital health design depicted on a flowchart diagram.
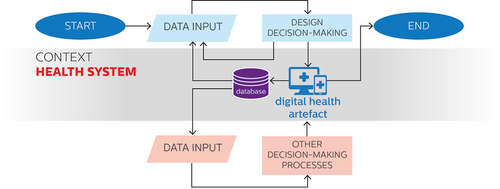
Table 1. Relative strengths of the four approaches to the use of data for digital health design on four desirable characteristics of the design process. Cells with question marks indicate the described strength to be still hypothetical, rather than robustly observed.
