Figures & data
Figure 1. A map showing the countries of origin of the patients from whom Plasmodium falciparum samples were collected in Doha, Qatar.
Table 1. Frequency (%) and number (n) of the Pfdhfr and Pfdhps mutations.
Figure 2. Mutation rates in P. falciparum genes (Pfdhfr,Pfdhps) that confer SP resistance from the isolates collected from East Africa, West and Central Africa and Indian subcontinent.
Table 2. The frequency distribution of genotypes for Pfdhfr and Pfdhps haplotypes among different nationalities.
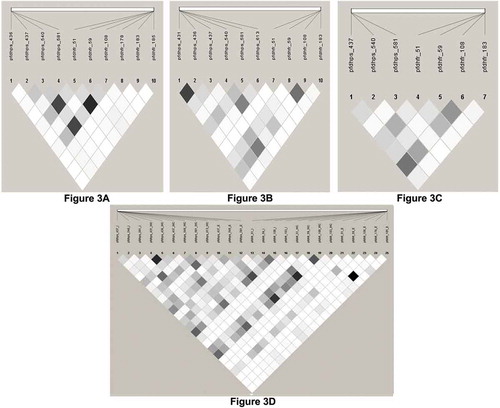
Figure 3. Linkage disequilibrium (LD) between pairs of SNPs located in Pfdhfr, Pfdhps genes implicated in SP drug resistance in imported P. falciparum cases in Qatar. The intra and inter-genic association between genes for the isolates collected from East Africa, West and Central Africa and Indian subcontinent were determined using the LD plot. The strength of LDbetween the SNPs was determined from the association of statistical significance by calculating the r2 values and represented by the darkness of the boxes.