
Figures & data
Figure 1. Overview of the methods to determine A Ag(PMB1) copy number and B Ag(PMB1) transgene integration site.
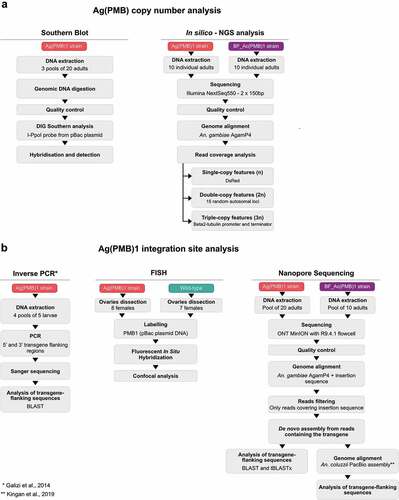
Figure 2. Potential chromosomal insertion sites of the Ag(PMB)1 transgene based on Inverse PCR and subsequent blast search in Vectorbase database. A A blast search of the sequence obtained by Inverse PCR revealed 12 autosomal locations with high sequence similarity (>90%) over long Inverse PCR sequence stretches (~700/788bp), including the Chr 3 R 36D location (3 R|47761729-47762482) previously proposed as the insertion site [Citation11]. B Southern blot probed with I-PpoI specific transgene sequences. As expected, a 8.7kb band was detected in ‘Plasmid’ positive control consisiting of pBac [3xP3-DsRed]b2eGFP::I-PpoI124L linearized with AfeI. No signals were detected in DraI-cut and ScaI-cut wild type genomic DNA. Single postive bands of the expected sizes, around 3 and 7kb, were detected in Ag(PMB)1 genomic DNA cut with DraI and ScaI. respectively. All numbers refer to DNA fragement sizes in kb. C Schematic maps of transgene insertion in Ag(PMB)1 at the Chromosome 3 R 36D and two newly identified potential integration sites on Chromosome 2 R in the Anopheles gambiae PEST reference genome (source Vectorbase: AgamPEST). Digestion of Ag(PMB)1 genomic DNA with DraI and ScaI is expected to produce 3.2 and 7–8.2kb fragments respectively, both of which can be detected using a probe against I-PpoI (in green). D Illumina sequencing reads aligned to the transgenic sequences and integration site flanking regions.
![Figure 2. Potential chromosomal insertion sites of the Ag(PMB)1 transgene based on Inverse PCR and subsequent blast search in Vectorbase database. A A blast search of the sequence obtained by Inverse PCR revealed 12 autosomal locations with high sequence similarity (>90%) over long Inverse PCR sequence stretches (~700/788bp), including the Chr 3 R 36D location (3 R|47761729-47762482) previously proposed as the insertion site [Citation11]. B Southern blot probed with I-PpoI specific transgene sequences. As expected, a 8.7kb band was detected in ‘Plasmid’ positive control consisiting of pBac [3xP3-DsRed]b2eGFP::I-PpoI124L linearized with AfeI. No signals were detected in DraI-cut and ScaI-cut wild type genomic DNA. Single postive bands of the expected sizes, around 3 and 7kb, were detected in Ag(PMB)1 genomic DNA cut with DraI and ScaI. respectively. All numbers refer to DNA fragement sizes in kb. C Schematic maps of transgene insertion in Ag(PMB)1 at the Chromosome 3 R 36D and two newly identified potential integration sites on Chromosome 2 R in the Anopheles gambiae PEST reference genome (source Vectorbase: AgamPEST). Digestion of Ag(PMB)1 genomic DNA with DraI and ScaI is expected to produce 3.2 and 7–8.2kb fragments respectively, both of which can be detected using a probe against I-PpoI (in green). D Illumina sequencing reads aligned to the transgenic sequences and integration site flanking regions.](/cms/asset/2a8257a9-c495-4bc8-b5ab-8ec4465a24f0/ypgh_a_2100192_f0002_oc.jpg)
Figure 3. WGS sequencing analysis of the PMB1 insertion site. A Alignment of the PMB1 transgene and flanking sequences from Inverse PCR (iPCR) from Ag(PMB)1 (New and [Citation11]), Illumina sequencing from Ag(PMB)1 and BF_Ac(PMB)1, Nanopore sequencing LSK* from BF_Ac(PMB)1), Nanopore Cas9 and Nanopore LSK from Ag(PMB)1. B Dot plot of the alignment between the de novo assembly of An. coluzzii genome (contigs on the y axis) and the AgamP4 PEST reference genome (on the x axis). The box shows the genomic position of the PacBio contigs (000035 F and 000049 F), where there was an alignment of the transgene flanking regions.
![Figure 3. WGS sequencing analysis of the PMB1 insertion site. A Alignment of the PMB1 transgene and flanking sequences from Inverse PCR (iPCR) from Ag(PMB)1 (New and [Citation11]), Illumina sequencing from Ag(PMB)1 and BF_Ac(PMB)1, Nanopore sequencing LSK* from BF_Ac(PMB)1), Nanopore Cas9 and Nanopore LSK from Ag(PMB)1. B Dot plot of the alignment between the de novo assembly of An. coluzzii genome (contigs on the y axis) and the AgamP4 PEST reference genome (on the x axis). The box shows the genomic position of the PacBio contigs (000035 F and 000049 F), where there was an alignment of the transgene flanking regions.](/cms/asset/f36b6cda-3351-4417-9acc-40dd9bab881f/ypgh_a_2100192_f0003_oc.jpg)
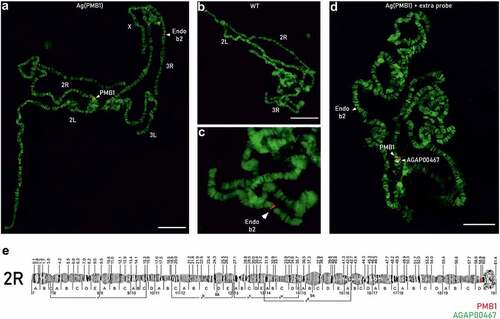
Figure 4. FISH analysis on polytene chromosomes of Ag(PMB)1 and wild-type (WT) mosquitoes. FISH was performed with a probe consisting of the original transformation plasmid specific to the transgene in Ag(PMB)1 individuals as well as the endogenous beta2 tubulin promoter (AGAP008622) on Chromosome 3 R:13,725,120 … 13,726,724 in WT and Ag(PMB)1 individuals A PMB1 samples showed two red signals labeling the endogenous beta2-tubulin promoter on chromosome 3 R and the PMB1 transgene insertion site in the proximity of the centromere of chromosome 2 R. B and C WT samples only showed one probe signal for the endogenous beta2 tubulin promoter in the distal region of chromosome 3 R D Signals from the PMB1 transgene (in red) and the flag gene AGAP004670 with known integration site (in white). E Chromosomal map of the proposed location of the PMB1 transgene and the reference gene (AGAP004670) with known chromosomal location at Chromosome 2 R: 60845862 … 60895998.