
Figures & data
Figure 1. PRISMA chart showing the inclusion of studies where CQ resistance was evaluated.
Wrong population – non P. vivax studies, non human studies, and the studies conducted outside india; Wrong study type – review article, letter to editors, case reports, conference abstracts.
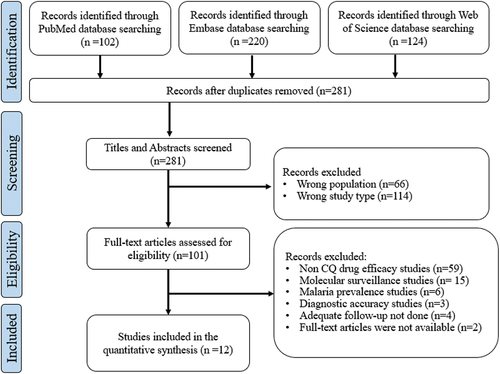
Table 1. Classification of treatment failures in-vivo efficacy studies.
Table 2. Classification of drug resistance criteria for in-vitro studies.
Figure 2. Location of the included study sites (except the study conducted by Mishra N et al.).

Figure 3. Flow chart of the patient enrollment and follow-up in CQ drug efficacy studies.
LFU – lost to follow-up; ETF – early treatment failure; LCF – late clinical failure; LPF – late parasitological failure.
Table 3. Methodological characteristics of included studies.
Table 4. Summary of CQ treatment failures in Plasmodium vivax malaria infections in India.
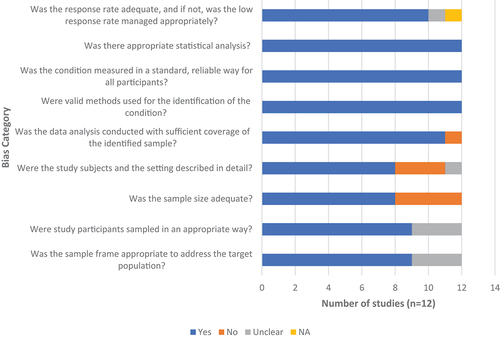
Figure 4. Risk of bias assessment by JBI’s critical appraisal checklist.
Supplemental material