Figures & data
Figure 1. Vector model future projections for the periods 2041–2060 and 2061–2080. Models of mosquitoes Ae. aegypti and Ae. albopictus, and of sylvatic species (Hg. janthinomys, Hg. leucocelaenus, Sa. chloropterus, Ae. luteocephalus, Ae. africanus, Ae. vittatus, Ae. niveus) for the current time (2001–2017) and average model projections into the future for the periods 2041–2060 and 2061–2080. Yellow triangles represent yellow fever vectors and red drops represent dengue vectors.
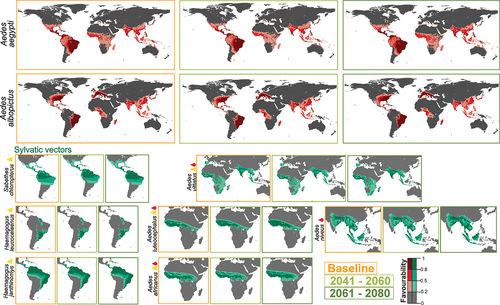
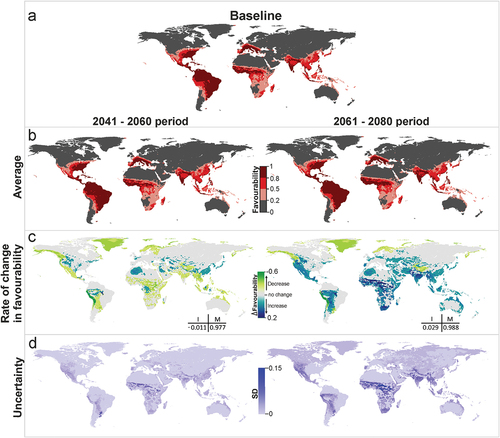
Figure 2. Dengue vector model projections into the future for the periods 2041–2060 and 2061–2080. (a) Vector model for the current time (2001–2017), (b) average model projections into the future for the periods 2041–2060 and 2061–2080, (c) areas where favourability increases and decreases in the future relative to the present. Difference between the future projection and the current model. I: increment rate; M: maintenance rate. Positive values of I indicate a net increase in favourability, that is, a gain in favourable areas, whereas negative values of I mean a net loss of favourable areas. M indicates the degree to which the favourable areas in the current model overlap with the favourable forecasted areas. (d) Uncertainty of the vector model in the period 2041–2060 and 2061–2080. SD: standard deviation. Zoomed maps of a regional scale can be found in the Supplemental Material.
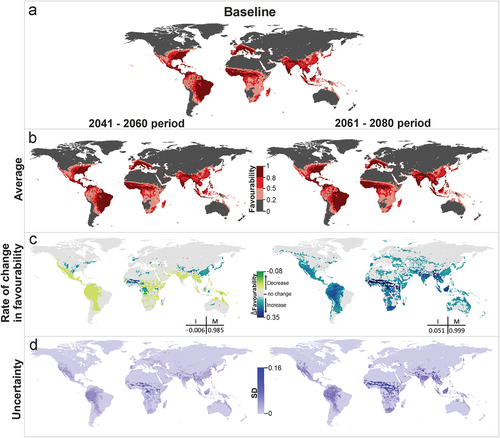
Figure 3. Yellow fever vector model future projections for the periods 2041–2060 and 2061–2080. (a) Vector model for the current time (2001–2017), (b) average model projections into the future for the periods 2041–2060 and 2061–2080, (c) areas where favourability increases and decreases in the future relative to the present. Difference between the future projection and the current model. I: increment rate; M: maintenance rate. Positive values of I indicate a net increase in favourability, that is, a gain in favourable areas, whereas negative values of I mean a net loss of favourable areas. M indicates the degree to which the favourable areas in the current model overlap with the favourable forecasted areas. (d) Uncertainty of the vector model in the period 2041–2060 and 2061–2080. SD: standard deviation. Zoomed maps of a regional scale can be found in the Supplemental Material.