Figures & data
Figure 1. Number of IVF cycles over time by fresh and frozen embryos, 1991–2019.
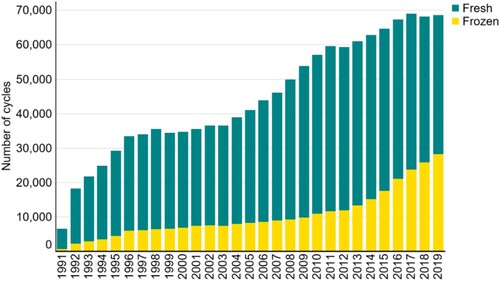
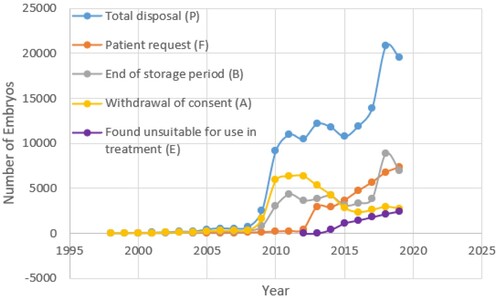
Table 1. The number of embryos discarded by reason between 1991–2019, constructed based on the data provided by HFEA in August 2022. Blank spaces indicate that no data were available. Estimated total disposal in each year is calculated using Equation (1): . *The data points ‘<5’ are averaged to 3 for expedience.
Figure 2. The estimated number of embryos in storage (U), embryo usage for treatment (J), yearly storage surplus (T), and new embryos stored (G), 1991–2019. The data were adopted from .
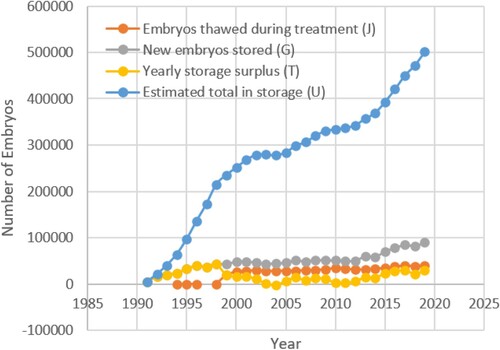
Figure 3. The rates of growth of estimated total in storage (calculated using Equation (4): ), embryo usage for treatment (calculated using Equation (5):
), and new embryos stored (calculated using Equation (6):
), 1991–2019. The data were derived from relevant data in .
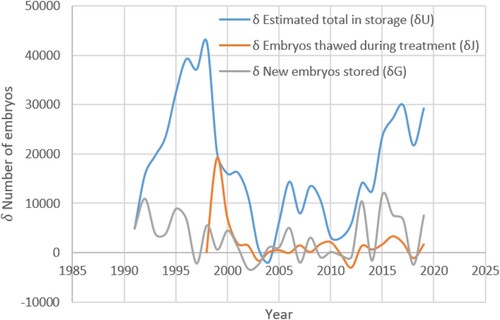
Table 2. The number of embryos stored, donated, thawed, and discarded between 1991–2019, constructed based on the data provided by HFEA in August 2022. Blank spaces indicate that no data were available. The estimated yearly surplus is calculated using Equation (2): . The estimated total embryos in storage at the end of each year is calculated using Equation (3):
. The U values are rounded up or down to the nearest thousand. *The data points ‘<5’ are averaged to 3 for expedience.
Figure 4. Number of donated embryos to other individuals from 1991–2019. The data were obtained from relevant date in .
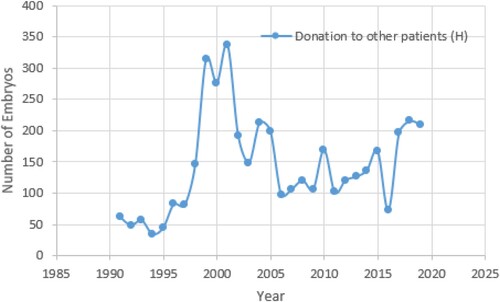
Figure 5. Number of embryos donated to research from 1991–2019. The data were obtained from relevant date in .
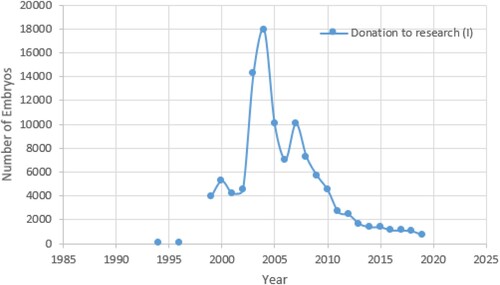
Figure 6. The relative number of embryos donated to other patients (calculated using Equation (7): ) and to research (calculated using Equation (8):
) as percentages of the estimated total in storage (U) from the same year, 1991–2019. These data are derived from relevant data in .
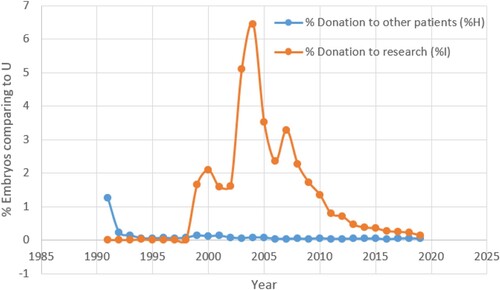
Figure 7. The number of estimated total disposal, as well as disposal by various reasons listed, 1996–2019. The data were adopted from . The number of embryos discarded under the reasons ‘no longer required for use in treatment’ and ‘donor sample discarded’ are very small, so they are not plotted in this figure.