
Figures & data
Figure 1. The online platforms used to share, discuss, and engage in research. The online attention published material receives on these platforms is tracked, in real time, by Altmetric Explorer, to produce alternative metrics detailing the nature and extent of the online attention.
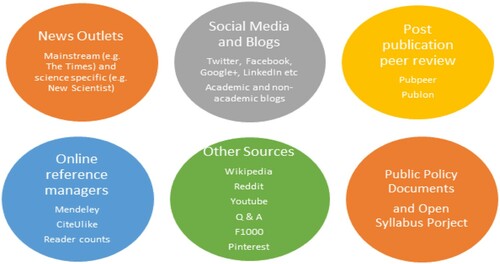
Figure 2. The Altmetric Donut – The sources monitored by Altmetric Explorer are listed in the above figure accompanied by their representative colour. To the right, the altmetric donut depicts the sources (colour of stripes) and the frequency of mentions (thickness of the stripes) with the altmetric attention score located in the centre of the donut.
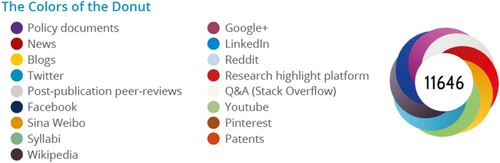
Figure 3. Distribution of the year of publications for the 100 dysphagia articles with the highest altmetric attention scores analysed in this study.
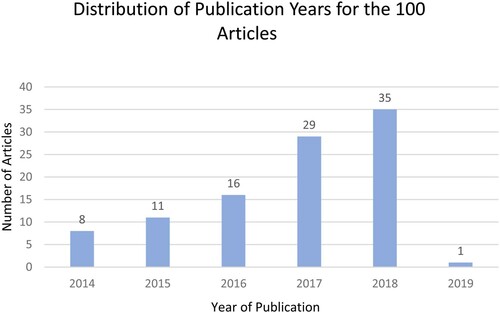
Table 1. Characteristics of the top 10 journals which published the greatest number of articles in descending order.
Figure 4. Percentage breakdown of the study designs of the dysphagia articles with the top 100 altmetric attention scores selected for analysis in this study.
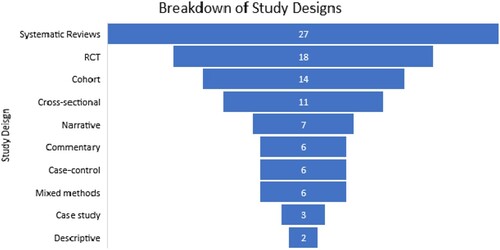
Figure 5. Percentage breakdown of the different clinical populations studied in the 100 dysphagia articles with the highest almetric attention scores selected for analysis in this study.
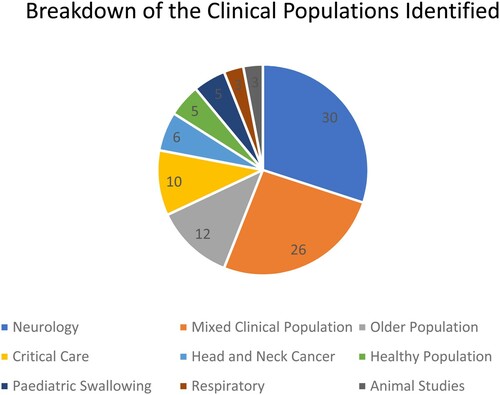
Table 2. ASS median and ranges obtained by altmetric studies in other healthcare disciplines. These scores provided a comparison for the results obtained in this study (AAS = Altmetric Attention Score).
Table 3. Descriptive statistics for mentions per media platform for the articles analysed in the present study (statistics generated by Altmetric Explorer).
Table 4. Articles in which news outlets contributed to the majority (minimum 50%) of their altmetric attention score (AAS).
Table 5. The three articles mentioned in policy during the selected study time frame (January 2014 to January 2019), including altmetric attention scores (AAS), citation data, access, and funding type.
Figure 6. Mentions received by the 100 dysphagia articles with the highest altmetric attention scores, from January 2014 to January 2019 grouped by online source of attention (see representative colours for each source below the graph). This figure highlights that Twitter contributes the greatest towards online mentions of dysphagia research within the selected study timeframe.
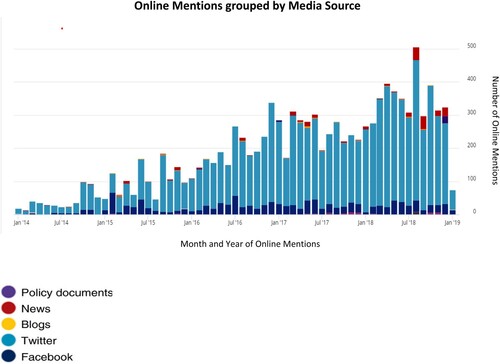
Table 6. The major geographic locations for online attention received by the top 100 articles (statistics generated by Altmetric Explorer).